
Click to learn more about author Thomas Frisendal.
I realized that I needed to know what the constituent parts of data models really are. Across the board, all platforms, all models etc. Is there anything similar to atoms and the (chemical) bonds that enables the formation of molecules?
My concerns were twofold:
- As part of my new book (Metadata Recycling into Graph Data Models) I wanted a simple, DIY-style, metadata repository for storing 3-level data models – what would the meta model of such a thing look like?
- I am to participate in the temporality discussions, and in that context atomicity is of essence.
I took a tour (again) in the Data Modeling zone, trying to deconstruct the absolutely essential metadata, which data modelers cannot do without. Follow me on a quick tour of the Data Modeling evolution over time.
Entity-Relationship Modeling
One of the first formal attempts at a framework for Data Modeling was the Entity-Relationship data model paradigm proposed by Peter Chen (ACM Transactions on Database Systems Volume 1 Issue 1, March 1976).
The diagram below is a (partial snapshot of a) Chen-style Entity / Relationship data model of Departments and Employees based on examples found in his 1976 ACM article mentioned above. Note that not all attributes are included (for space-saving reasons).
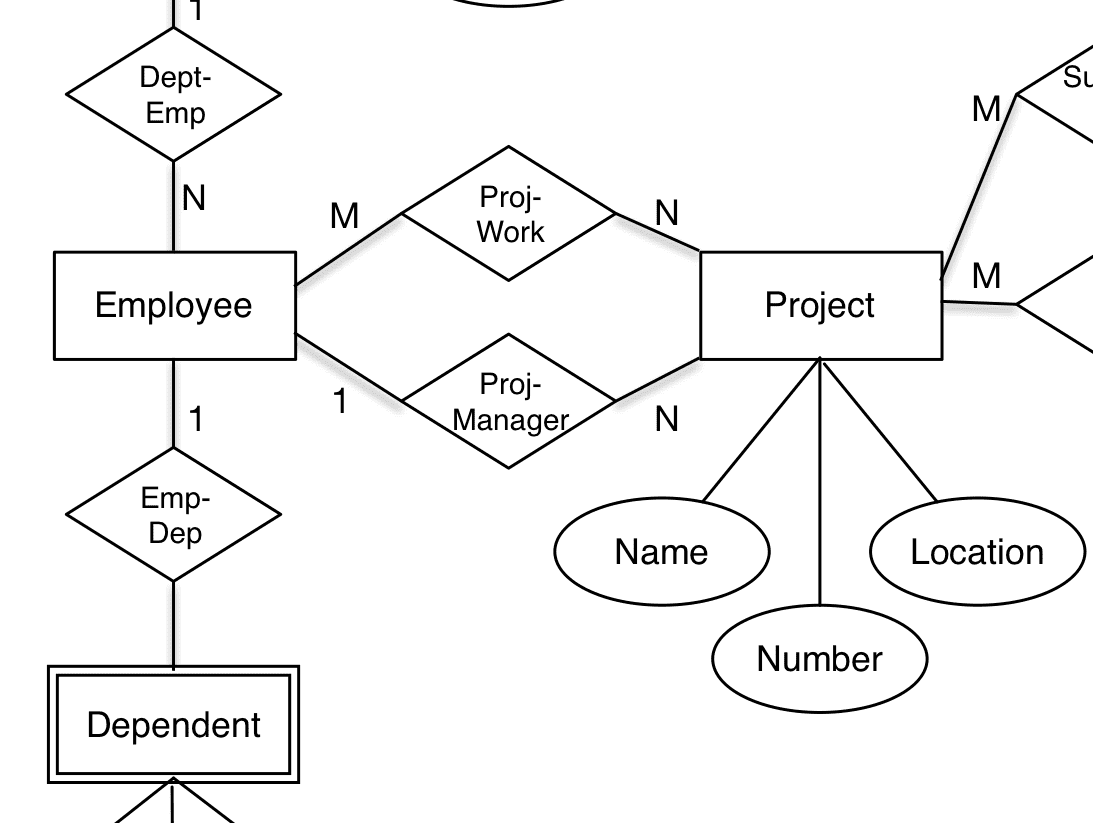
Notice that in the original Chen-style, the attributes are somewhat independent and the relationships between entities are named and carry cardinalities (“how many” participants in each end of the relationship).
I like the explicitness of classic Chen modeling. Attributes are related to their “owner” “entity” in what other people called “functional dependencies”.
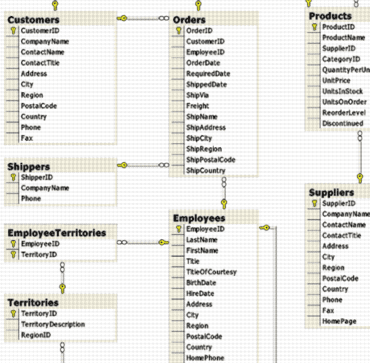
After Entity-Relationship modeling things took other directions leading the generic ER-diagrams in many styles. Here is (a part of) the Microsoft Northwind example database in the SQL Server diagramming tool:
Copyright (c) 2015 Clifford Heath.
Note that the attributes have now been folded into the entities, which came to be called tables (in the SQL sense). With the advent of SQL, the named relationships were not named anymore. Since foreign key relationships are constraints, and constraints may have names in most SQL implementations, it really is strange why this happened. From a business semantics perspective, this is a very sad loss of information.
Relational and SQL
Before SQL there was the relational model, which was published by Dr. Ted Codd in 1970 (Codd, E. F., A Relational Model of Data for Large Shared Data Banks, Comm. Of the ACM 13, 6 June 1970).
Looking back, there are some key issues, which were of high importance for the paradigm shift:
- The relations (tables) are the key components (although the name of model suggests that relationships should be the core)
- The tables should be “normalized” and intra-table relationships should be defined using “primary” and “foreign” “keys.
If you ask me, the major contribution of “The Relational Model” is the focus on functional dependencies, which is at the very heart of Data Modeling. Because that is where the “structure” is residing. Functional dependency is originally a mathematical term, which indicates that something (a concept) is completely derived (by way of a function) from something that controls it (and possibly many other concepts). For example, a Status attribute is describing something very specific, of which it is “functionally dependent”:
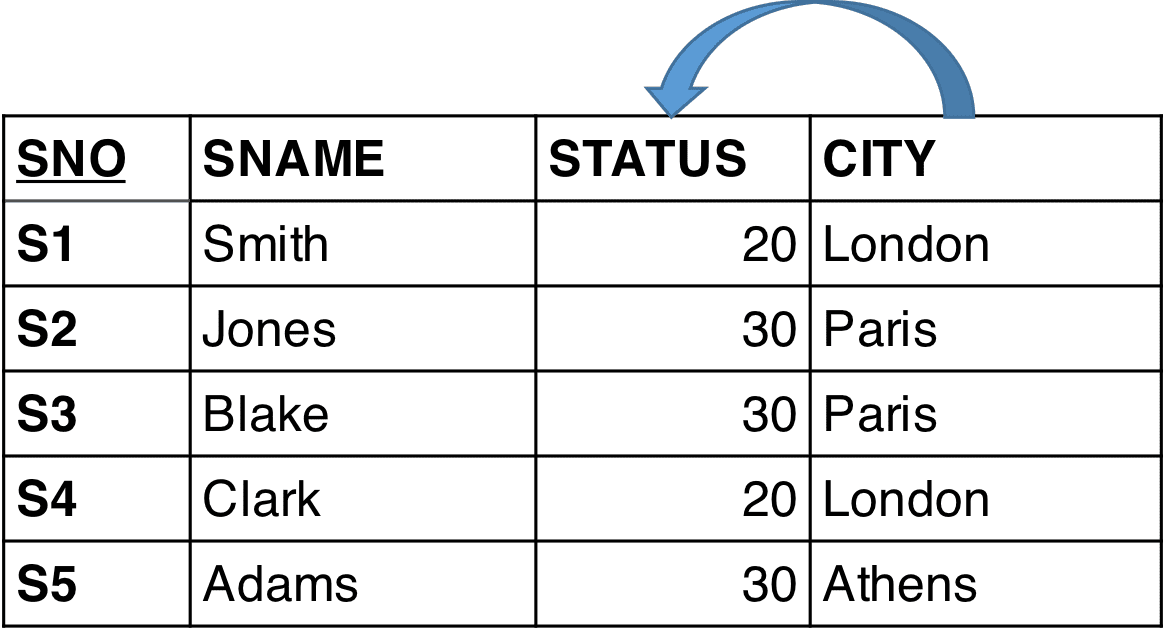
Is it describing the status of the Supplier or the City? What if it is depending functionally on CITY? We cannot see this since we just have the colocation as indication of dependencies. (The example is used in several textbooks by Dr. Codd’s close cooperator, Chris Date).
Third normal form is considered the desired state to be in. Loosely stated it simply means that all attributes are functionally dependent on the primary key.
Getting the keys and functional dependencies in order is the target of “normalization”.
Object Orientation and UML®
A “counter revolution” against the relational movement was attempted in the 90’s. Graphical user interfaces came to dominate and they required advanced programming environments. Functionality like inheritance, sub-typing and instantiation helped programmers combat the complexities of highly interactive user dialogs.
The corresponding Data Modeling tool is the Unified Modeling Language, UML®. UML® class diagrams may look like this:
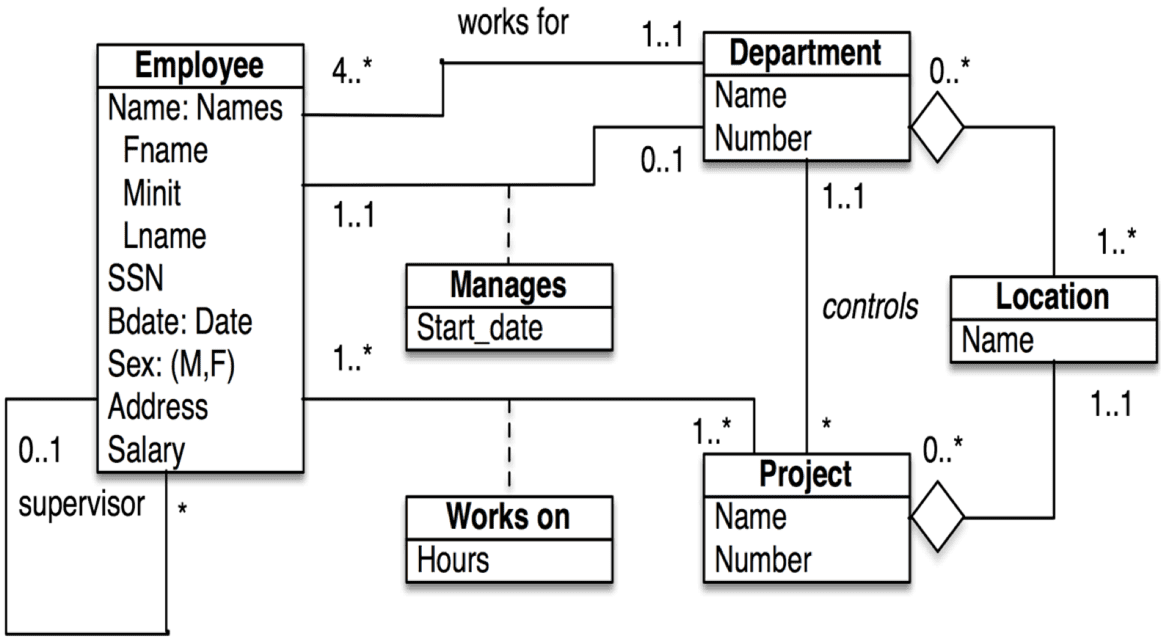
Above, you see parts of the Department and Employee data model expressed in UML® (in a slightly simplified manner). Frankly, I much prefer Peter Chen’s representation covered a couple of sections ago.
Graph Data Models
Yet another counter revolution happened at about the same time: Graphs emerged as data models in the late 1990’s.
For many years, formal graphs have been part of mathematics and they are a well-researched area. In the Data Modeling community, however, graphs emerged remarkably late. The graph types of particular interest to data modelers are the directed graphs. This means that the relationships (edges) between nodes are directed. And that is a natural fit with the nature of semantics and, consequently, with the nature of data models (which represent business semantics).
One of the great misconceptions of the Data Modeling community has been that relational databases are about relationships. They are not. In fact, the relational model focused on “relations” (“relvars”) in the sense of having related attributes existing together in the table representing a tangible or abstract entity (type). So the “relations” in the relational model are the functional dependencies between attributes and keys (also attributes). Relationships in the sense that there is a relationship between Customer and Order are “constraints”. Some constraints in SQL are the “foreign keys,” which is as high as you get as an attribute, after being a primary key, of course.
Caveat: the world is full of relationships, and they express vivid dynamics. This is the space that the graph data models explore. If you ask me, structure (relationships) is of higher importance than contents (the list of properties). Visuals are a great help and visualizing structure is the same as saying “draw a graph of it.”
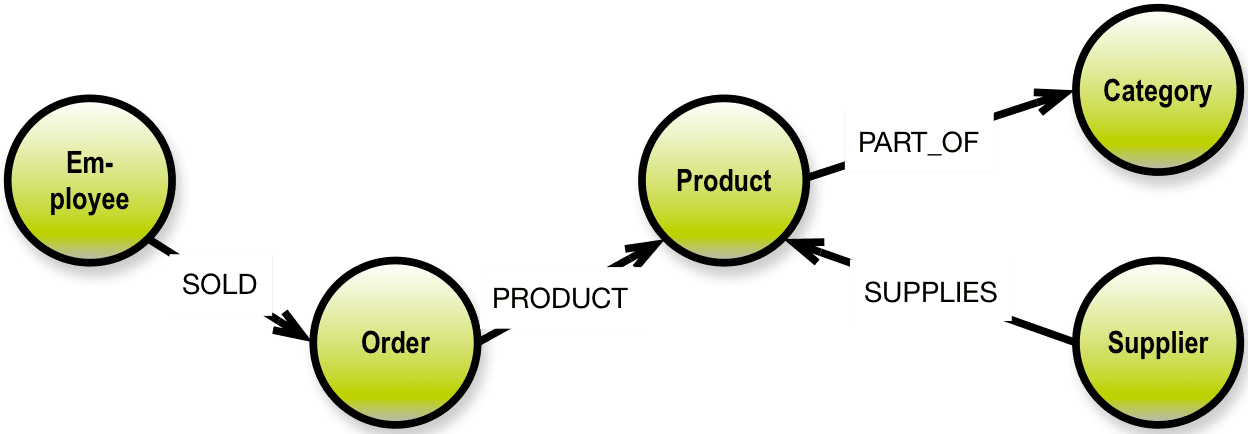
In a graph database, traversal of highly connected data is very simple (that is what they were invented to do). Neo4J has the following example on their homepage based on the Microsoft Northwind demo database. The database is about products, orders, employees and customers.
A user story could be:
As an analyst I need to know which Employee had the highest cross-selling count of Chocolate and which other Product?
The graph looks like this:
The last ten years have seen the emergence of some quite successful graph products. There are two primary paradigms, which are in production use at more and more (and larger and larger) sites today:
- The “semantic web” category of graph databases, networks of “triples” representing subject-predicate-object “sentences” in the RDF (XML) language and
- Property Graphs, which extend the directed graph paradigm with the concept of properties located on nodes, and also potentially on relationships.
The Property Graph Model is a relatively late newcomer and it is based on these concepts:

Property graphs are essentially directed graphs consisting of nodes and edges (called relationships in the property graph context). In addition, property graph nodes may have:
- Properties and
- Labels
Properties are used for storing data about the things that the nodes represent (a.k.a. “attributes” in other modeling paradigms). Labels are provided for just that, labeling, in some systems (e.g. Neo4J).
Relationships are basically connections, but they also carry a name (type) and can carry some properties. Properties of relationships are recommended to be properties of the relationship in its’ own right, for instance weights, distances, strengths, and time intervals. An example could be ownership percentages between some property owners and the properties of which they individually own some parts.
The property graph data model is a simple, powerful general purpose data model. For those reasons, I recommend to use it as a generic representation of any data model.
In his seminal work, “The Entity-Relationship Model – Toward a Unified View of Data” from ACM Transactions on Database Systems, Vol. 1, No. 1. March 1976, Peter Chen already then went to the “atomic level” before constructing his Entity-Relationship paradigm from those bottom-level drawings, something like this:
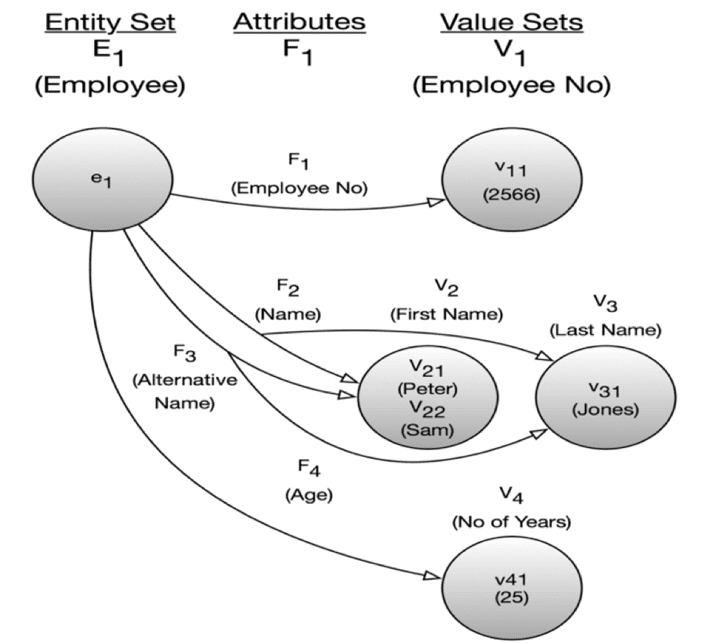
What you see above is actually a directed graph representing a piece of a data model at the most “atomic level.” Chen’s work really is quite similar to the graph models depicted earlier in this chapter. And he published this in 1976!
Fact Modeling
This atomic level of detail is used by another school of modelers working with “fact modeling.” Their approach is not new. It goes back to the 70es, where Eckhard Falckenberg and Sjir Nijssen started working on the approach (in parallel).
Fact Modeling was known for many years as Object-Role-Modeling (ORM), and it was supported by the popular Visio diagramming tool at the time that Microsoft bought the company behind Visio. I like Nijssens name “Binary Relationship Modeling” a lot and it has been in the back of my head since the early 80es.
Fact Modeling is definitely at the right level (concepts and their relationships), but it also contains all of the logic details required for formal, precise specifications. The visual syntax goes back to: Nijssen, G.M. and T.A. Halpin. Conceptual Schema and Relational Database Design—A fact oriented approach. Prentice Hall 1989.
It is certainly a lot more precise and detailed than the concept mapping that I usually propose. ORM can handle even the most complex semantic challenges and it is absolutely fine for describing business rules in general. However, precision comes at a cost, and this makes it (fact modeling) as complex as UML® and in consequence, it is not suited for business-facing specifications (the visual syntax looks too complex for most business people). Here is a very simple example of what today is called Fact Modeling:

By Jakob Voss (own work) [Public domain], via Wikimedia Commons).
Fact Modeling is indeed at the level of individual concepts having properties and named relationships. In consequence, it is a graph data model. With many bells and whistles. Also note the “verbalization” technique” used to describe the “facts” (which I see as relationhips, born, hired, uses …).
This brings us to an important observation.
Nouns and Verbs
My focus is on the core components of data models. And if you scrape off all the DBMS-related technicalities, what remains is (mostly) the conceptual structure and meaning that describes a business context.
In this article you have already seen that both concept maps (cf. the concept map of the property graph concepts above) and fact modeling use metaphors derived from linguistic structures, i.e. things that resemble nouns (concepts, entity types) and some things (relationships) that resemble verbs (linking phrases in concept maps and fact type readings in fact models).
For concept maps this is no coincidence. Concept maps were invented in the 70es in a group of psychology researchers around Prof. Joseph D. Novak (look him up at the IHMC in Florida). Their field is the psychology of learning, and concept maps are based on the psychology of perception and cognition.
In fact, Prof. Sidney Lamb has, in the 90es, arrived at similar conclusions. His field is neurocognitive linguistics (look him up at Rice University).
The core of his work is around nouns, verbs and “relational networks”. (Thanks to John Siegrist for pointing me to this work).
“Nouns” and “verbs” and “networks” are core constituent parts of data models. As the fact modelers put it, it is all about communication oriented modeling of information.
The Key Thingies
Another important constituent part of data models is keys. One of the common mistakes in modeling is that primary keys (and by definition then also foreign keys) are single-valued. In many cases, though, that is not the case. Concatenated, complex keys are common at the business level.
Business level primary keys, even be they single-valued, get into some real-life problems:
- Primary key values (e.g. Employee Number) may be reused by the business after a few years, causing troubles in historical data such as data warehouse data and the like.
- Consolidation of data from different sources may lead to key clashes.
- The same physical object instance (e.g. Department) may change its key (Department Number) for a number of reasons including organizational changes.
The notion of the surrogate key evolved (also around 1976) to address those issues. The idea is that the business level key (be it single- or multi-valued) is mapped to a system-generated, unique, surrogate key (typically a completely non-information bearing number). This is by many considered best practice relational design today; and has been so for quite some years.
As for the uniqueness aspects, SQL data modelers have adapted the very appropriate term “alternate key,” typically denoting the business-level (single- or multi-valued) key(s).
So what you end up with today is typically something like:
- A physical primary key being a surrogate key (uniqueness controlled be DBMS level things like e.g. an index)
- A business level “identification”
- A business level “Name”
- The business level (alternate) key fields with support from a DBMS level thing like a concatenated index.
The Universal Constituent Parts of Data Models
Let us try to gather the constituent parts, which we identified as being frequently used across the various Data Modeling paradigms over the last 40+ years.
The diagram below is a property graph schema in the style I prefer, cf. my book from 2016 Graph Data Modeling for NoSQL and SQL. It contains most of the metadata parts, which we need:

Note that identity is expressed in italics, uniqueness is expressed as bold and cardinality is expressed as either one-one (no arrow) or one-many (arrow in one end). I also use many-to-many by way of arrowheads in both ends. Mandatory optionality I normally consider to be derived from identity and uniqueness.
Now, in conclusion, we see that what really makes data models tick, are these parts:
- Concepts, which materialize as either
- Object types (Customer, Order etc.), or
- Properties (CustomerNumber, ProductName etc., some of which are mandatory)
- Dependencies, which structure the model as
either:
- Functional dependencies (internal within the object type and determining the primary key), or
- Intra-object relationships (like “business
address of” and so forth), which have
- Cardinalities
- An associated key, which can be either a single identity or a combined set of uniqueness criteria
- a type (name, not always present)
- a direction (from/to, not always present)
- Uniqueness criteria (object type level),
- either an identifying property (key) or
- (frequently) a list of concatenated properties
- Identity (object type level),
- either a single identifying property (key) like CustomerNumber, or
- a system generated surrogate key
- Data types
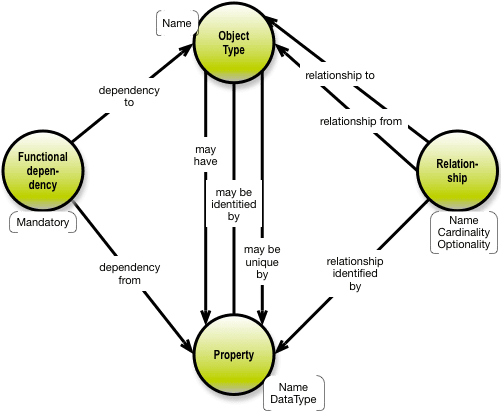
Dressed up as a conceptual property graph, the constituent parts relate to each other like this:
When we do model-to-model transformations of metadata (as I do in my new book), we should be looking for those things. But are they readily available? Here is a map of the data model constituent parts:
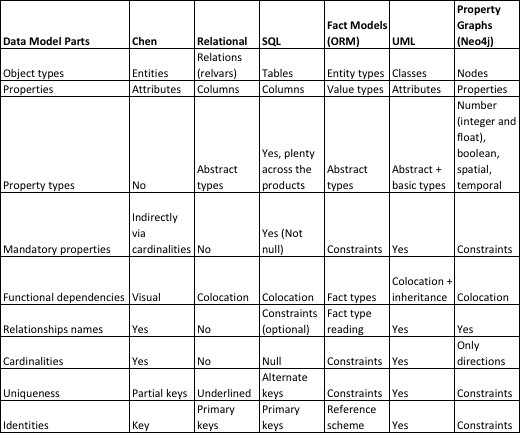
With only a few exceptions is does indeed seem that the table above scopes the “Universal Constituent Parts” of data models across the board.
Practical Use Cases
As I said in the preamble, I have two concerns, which I try to address with this analysis.
One is the metadata repository model discussion. The one I have decided upon is close to the above, and it is described in quite some detail in my Metadata Recycling book.
The other concern is that of temporal modeling. I have learned that when it comes to versioning of data across multiple timelines, the devil is in the detail… I aim to, sometime soon, establish a framework for temporal issues based on the scope established here. Stay tuned – and feel free to send me comments on info at graphdatamodeling.com.
