
Click to learn more about author Thomas Frisendal.
Preamble: Five years ago, I wrote a book about a new approach to Data Modeling — one that “turns the inside out.” It discussed visual Graph Data Modeling. For well over 30 years, relational modeling and normalization were the name of the game. One could ask that if normalization was the answer, what was the problem? But there is something upside-down in that approach.
Data analysis (and modeling) is much like exploration — almost literally. The data modeler wanders around searching for structure and content. This requires perception and cognitive skills, supported by intuition (a psychological phenomenon), that, together, will determine how well the landscape of business semantics is mapped.
Mapping is what we do; we explore the unknowns, draw the maps, and post the “Here be dragons” warnings. Of course, there are technical skills involved, and, surprisingly, the most important ones come from psychology and visualization (i.e., perception and cognition) rather than pure mathematical ability. Think of concept maps versus UML. And think of graphs versus SQL.
Thus, two compelling events made a paradigm shift in Data Modeling possible and also necessary:
- The advances in applied cognitive psychology to address the needs for a proper contextual framework and for better communication, also in Data Modeling
- The rapid intake of non-relational technologies (NoSQL, including graph technologies)
As you know by now, this paradigm shift has already happened: Graph Data Modeling exhibits very visual and intuitive diagrams, which are based on the property graph paradigm, having nodes, relationships, and properties.
What, then, is the current state of this (property) graph Data Modeling universe? (I also have a few comments on the RDF/OWL side of the house and will get to that later).
The Big Picture: Who is into Visual Graph Data Models?
In 2017, I started building the page Graph Data Modeling Hall of Fame on my graph Data Modeling site. Back then, only a few vendors and products met the qualifications to be included. The requirements were “…product should use visual, interactive, graph representation of a Data Model. The framing of the context is the property graph model as defined here, but plain directed graphs or hybrids are also welcome.”
Today, I have identified several (and in some cases, vendors have found me). So now, the list is comprised of 25 products:
As you can see, these products span far and wide — from developer tools and data catalogs to BI tools, graph databases, and collaborative tools. My inclusion criteria do not require the product to be a modeling tool per se, only that it visualizes graph data models (as graphs).
I am excited to see that so many different uses cases prosper from visual graph Data Models; follow the links up above, and you will see. And I am sure there are more products and use cases out there. If you know of one, send an email to info@graphdatamodeling.com.
One multi-model database has made its way into the Hall of Fame (AnzoGraph). We also find some tools which are mostly in the RDF/OWL space on the list (Grafo, which I will discuss more below, in addition to TopBraid).
There are also some fact modeling/business rule products present. In fact, such tools, if you ask me, are all graph Data Modeling tools (because a fact model can be almost mechanically converted to a property graph).
Hard Hat Data Modeling Tools and Schema Editors
When it comes to Data Modeling tools in the classic sense, there are only a few in the Hall of Fame. Not because I don’t want them there, but the schema-free traditions in the property graph universe have not, until now, been sporting hard hat Data Modeling practices. But, there are some good-looking exceptions, as you can see below.
First of all, you would expect some modeling and schema editing support in database products. But in the Hall of Fame, we find only Datastax, Neo4j, and TigerGraph. And it is fair to say that only TigerGraph’s Studio reminds me of a Data Modeling tool, like, for example, Oracle’s (just to mention one). Datastax has some visuals in its Studio, and Neo4j has a field-developed diagram (SVG) and code-generator (Arrows) — also after the fact schema visualization in the desktop browser. Additionally, the Neo4j ETL tool actually has some modeling-like features based on a repository (which is not in a database, yet). We will have a brief look at TigerGraph further below.
Writing this post, I realize Microsoft SQL Server ought to be in the Hall of Fame because of features in both the Management Studio, Visio, and Power BI. I will take care of that.
But, in the Hall of Fame, we also find two development tools (Structr and Graphileon) that can be used for Data Modeling as part of their development toolkit. We will look a little bit closer at Graphileon down below.
For dedicated Data Modeling toolkits, you have to go to two specialized modeling tools, NodeEra and Hackolade. We will also take a look at them further below. Before that, however, the last time I counted, there were around 25 property graph database products, so, clearly, I must be missing some features in some products. Please let me know if you think of anything that could be interesting for the Hall of Fame.
So, let’s take a look at some of the graph tools supporting property graph Data Models.
Grafo
According to their homepage, Grafo lets you design knowledge graphs the same way you present them: visually. I am a paying customer, and I use Grafo to visualize RDF/OWL files as well as look at property graph designs.
Grafo is centered around concepts and how to relate them. It is rather easy to visually design a knowledge graph or a property graph. Here is a snippet from inside the tool:

There is already quite a lot of functionality, including:
- Capability to create, manage, and evolve knowledge graphs
- RDF and property graph options
- Collaborative editing of documents
- Participation in threaded comments at the object level
- Tracking of changes (every change is tracked) — view and revert to old versions effortlessly
- Ability to import and export both OWL and TTL documents
- Option to export to a few potential property graph formats
Here is another snippet of a property graph (from their homepage):
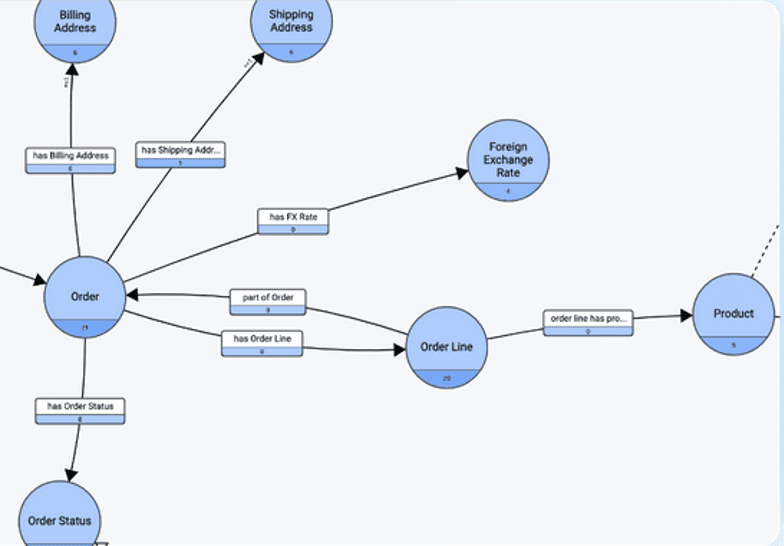
Grafo’s homepage is here. The company behind Grafo is data.world.
Graphileon
Graphileon helps business consultants and information analysts to rapidly design and deploy graph-based applications by exploiting the agility of graphs (this information is adapted from their homepage).
One of the use cases of Graphileon is user-friendly, controlled Data Management using a schema builder and a databuilder to control the categories of users that are allowed to add new attributes to nodes and relationships while providing other users with access to forms to enter data.
One of the advantages of property graphs like Neo4j, in which both nodes and relationships can have properties, is their versatility and freedom to create and update models. However, this freedom comes with responsibility. Sometimes you may want to control the categories of users that are allowed to add new attributes to nodes and relationships, while you want to provide other users access to forms to enter data.
Here is a little snippet from the schema builder showing only one node:

In the schema builder (above), nodetypes and relationtypes are created, then linked to attributes with different datatypes (string, integer, etc.). Both nodetypes and relationtypes can inherit attributes.
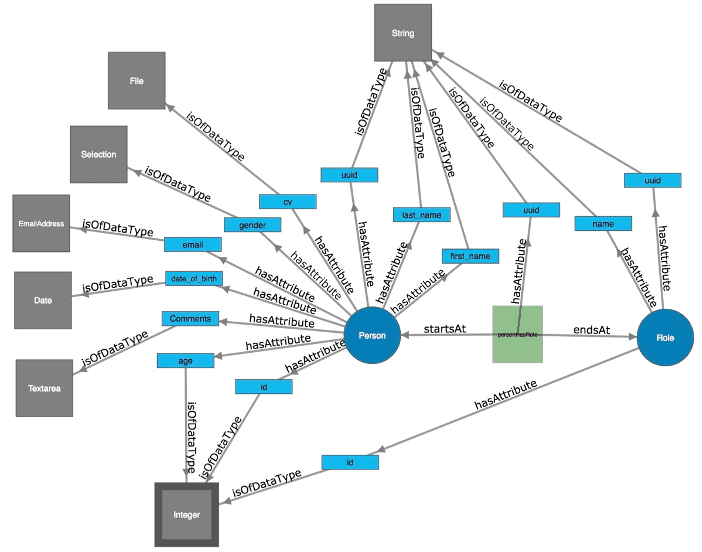
For a “person” nodetype, with attributes of different types, the schema could look like the graph Data Model above.
These components of Graphileon are real Data Modeling tools for Neo4j property graph database designs, but they are not supported in the personal (free) edition. Read more about them here. I have not had the opportunity to review this functionality, but I hope to do so in the future.
Graphileon is based in The Netherlands. Their homepage can be found here.
Hackolade
Hackolade offers agile visual Data Modeling for JSON, NoSQL, and multi-model databases, and it now supports Neo4j graph Data Models as well.
It was specifically built to support the Data Modeling of Neo4j node labels and relationship types. The application closely follows the terminology of the database. To be clear, Hackolade is not a graph visualization tool, but a tool for the Data Modeling of Neo4j graph databases — and many other databases.
Here follows a screenshot from the Neo4j part of the product:
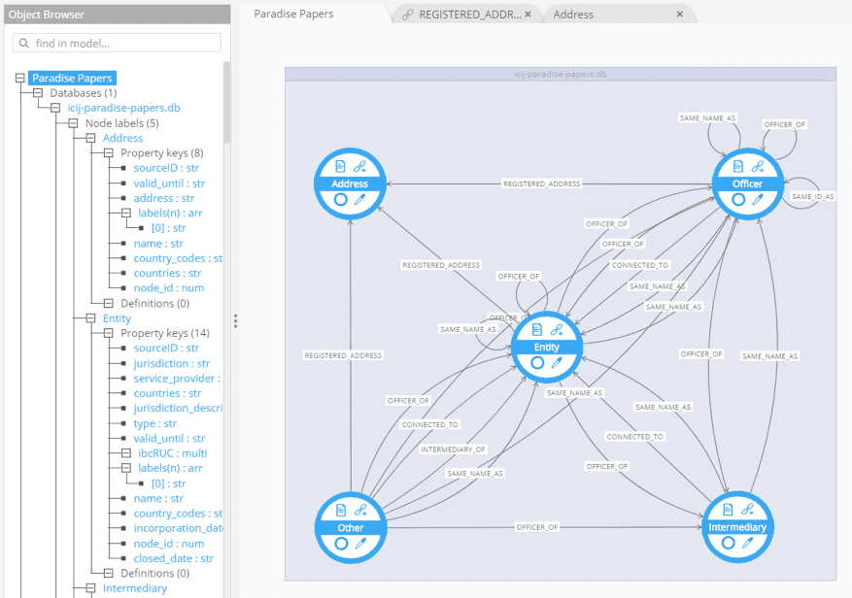
The new Neo4j graph Data Modeling interface looks very nice and offers comprehensive coverage of the graph Data Modeling features of graph databases in Neo4j. I will do a more elaborate review when time permits.
Recently, Hackolade introduced support for ArangoDB, and here we find a good solution to the drop-down display of properties:
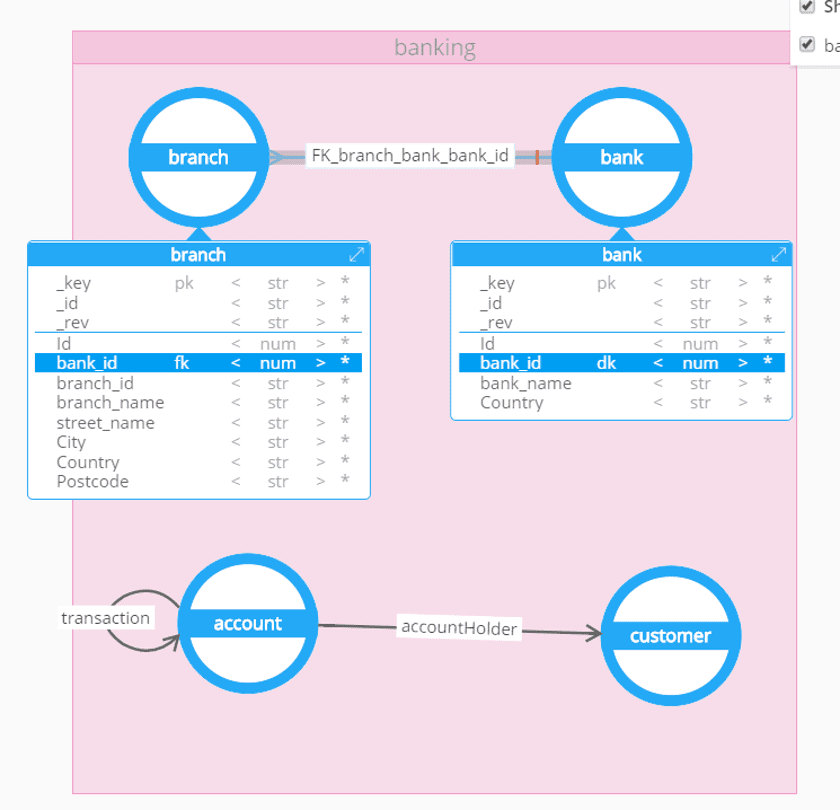
Hackolade is a product of IntegrIT SA/NV, and its homepage is found here. The company is based in Belgium.
NodeEra
John Singer, Founder and CEO of NodeEra, says this about NodeEra on its homepage:
“After 35 years of working with relational databases, I discovered Neo4j and the property graph Data Model. Like you, I could see the advantages of this new approach to representing information in a database. While the property graph won’t be replacing all relational databases (yet), it is particularly well suited for what I was working on. As a relational data modeler, data analyst, DBA, I soon discovered that Neo4j lacked the types of tools I was used to working with — Data Modeling and query management — so I set out to build the tools I wish I had, and NodeEra was born! One of the exciting aspects of Neo4j’s property graph model is it’s “schema-on-demand” design. NodeEra implements this dynamic, iterative approach to property graph design that I believe you will find useful, more productive, and best of all — fun!”
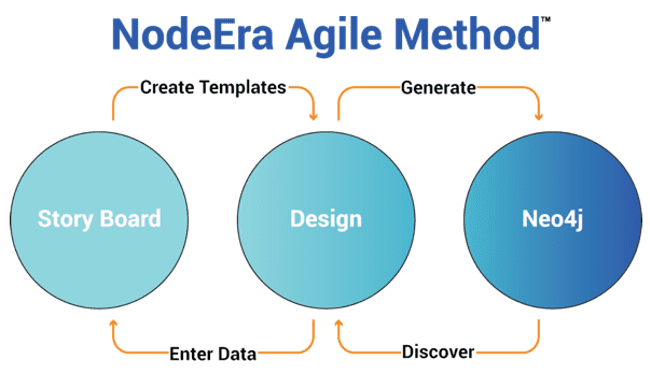
NodeEra also does instance diagrams used in the agile modeling process:
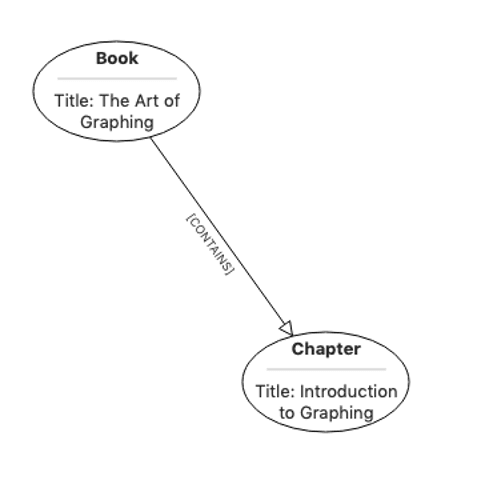
NodeEra includes functionality for: managing schema objects, cypher editor, editable data grid, template diagrams, instance diagrams, and reverse engineering. I am hands-on with NodeEra, trying to work with it in practice, and I will write a more comprehensive review when time permits.
NodeEra’s homepage is here. The company was founded in the U.S.
TigerGraph
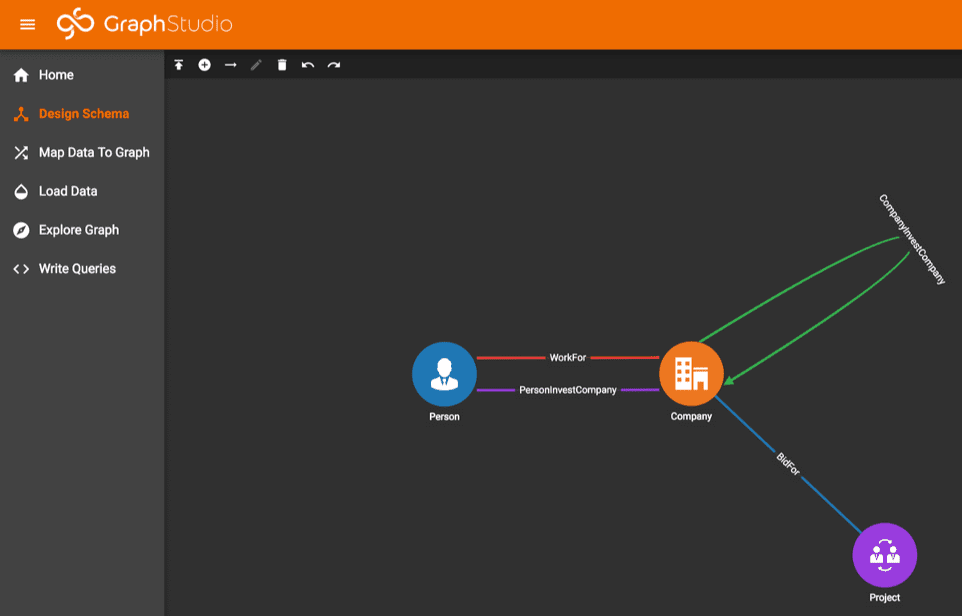
I’m including a quick look at TigerGraph Studio here because I do expect many more graph database products to have such a facility in the near future. The forthcoming GQL standard will have important elements of schema functionality, and TigerGraph already has some of that today.
GraphStudio is a simple yet powerful graphical user interface. It integrates all the phases of graph data analytics into one easy-to-use graphical user interface. It also includes schema design:
TigerGraph’s homepage is here. The company was founded in the U.S.
Is the Grass Greener on the Other Side?
Some readers will remember that I strongly support better interoperability between the two major communities in the graph space. A fair question could be: Is the hard hat support for Data Modeling and schema-like governance better on the semantic RDF/OWL side? And the answer has to be, for the moment, a solid yes. There are plenty of ontology and taxonomy tools in that space, and they have been doing it for several years. Things are not standing still, though. Look at Grafo, which comes from that world — a nice, crisp user interface, which, in fact, is based on a recent, open-source project called WebVOWL. I am completely happy with that style.
RDF/OWL has a tradition of “open world assumptions” — meaning that missing information is ok and to be expected. If your background is information and knowledge acquisition, that may well make sense, but in many other use cases, it does not. Stardog has a good schema-style quality control, and TerminusDB is probably the best example of rigorously enforceable control, based on OWL. And the use cases are plenty.
What is good here is that enhanced interoperability between property graph and RDF/OWL will offer ontologies and taxonomies to be reused in the property graph world, and can bring a dramatic increase in the level of “schema-controlled” (by way of ontologies and taxonomies) Data Quality and Data Governance, also in the property graph applications. And that will open some doors in the tightly regulated industries such as finance, law, and pharma (not forgetting the complex use cases in the tech sector, by the way).
So, the outlook is good! Smooth sailing and beautiful shores are ahead once we get a few things right (such as the graph query language standard).
