Click to learn more about author Thomas Frisendal.
2020 is a nice number and sounds comforting. And it is about vision(s). Are there any foresights of importance for data modelers? Well, here are 10 suggestions. No warranties, I suggest you use them as lighthouses, hopefully plotting your course from 2020 onwards.
Business Value in Data Models
We, as a profession, have not been convincingly successful in all of our “inventions” in the quest for the approach to data modeling that actually delivers business value. Trying to hide uncertainty behind complex engineering methodologies, including formal logic and the full monty of classes with inheritance etc., has actually scared a good many (business) people. Fortunately, some data modelers have continued to deliver conceptual models, which are simple (intuitive) to understand and form contracts between business and developers about scope, meaning and structure of an undertaking.
One of the reasons for the attractiveness of graph technology is the simplicity of the data models – simplicity which does not sacrifice semantics, when you actually need that.
The rush to AI and ML has created a new rush towards data models, this time under the umbrella of “Knowledge Graphs”. AI/ML need good data models, and there is a symbiotic relationship between AI models and the underlying data models.

In 2020 many new data models will be developed for good business reasons. They will be simple (graphs, for example), they will be easy to understand, and they will accelerate the business value of new applications.
Towards the Confederation of Data Models
Semantic Graphs, Property Graphs and SQL Property Graphs are becoming close friends. Building bridges is definitely the right thing to do, when synergi is on the agenda.

The international standards committee ISO/IEC JTC1 SC32 WG3 Database Languages, best known as the SQL-committee, has decided to add support for property graph queries within SQL (SQL/PGQ). Not only that, there is now an officially proposed standard for a declarative Property Graph Query Language (GQL) that builds on foundational elements from the SQL Standards such as data types, operations, and transactions. Being the Danish representative to the committee I am going to follow this closely and contribute as best I can. So, SQL meets property graphs and vice versa.
It is also exciting that the RDF-world and the property graph world(s) are getting closer. The proof is the emergence of RDF* and SPARQL*, which aim to reduce the structural differences between the two worlds. Properties on relationships is a good example of this. RDF* is already supported by 3 semantic technology vendors (Cambridge Semantics, Blazegraph and Stardog). RDF* and SPARQL* are proposed to the W3C (definer of RDF and SPARQL), and in my opinion this work is important and should have priority.
In 2020 the contours of “The Confederation of Graph Data Models” will be taking shape. For data modelers this obviously implies that we must prepare for a “universal” approach to data modeling across all 3 realms. Interesting times!
The Duck-billed Platypus: At the Very Heart of Data Modeling!
Remember this little guy? Here is what Wikipedia says about her/him (https://en.wikipedia.org/wiki/Platypus ):


This perfectly natural creature actually breaks the laws of class hierarchies and inheritance several times. It represents many-to-many relationships between distinct hierarchies and subtypes of species (egg-laying, duck-billed, beaver-tailed, otter-footed, venomous). How many dimensions do you need to model this in a star schema?
Yes, but this is an animal, not a business, you might argue. But that does not hold. Like the Platypus, who evolved from ancestors, whatever we humans do, is also constructs developed by biological circumstances. Our control mechanisms are known as Cognitive Psychology, not Category Theory. The most common rule is that there are many exceptions.
What do you call a mesh of M:M relationships representing structures like this specific taxonomy of the Platypus? It is a graph. This is why graph data modeling is better suited to address the requirements and oddities of the real world.
The proliferation of graph data models will raise in 2020, for reasons like the wonders of the Platypus.
If you don’t believe me, look at a recent, humanly created, and contradictory, construct: The context and meaning of the so-called “CO2-credits” – try to understand and model that.
Knowledge Graphs – New Blood to the Operational Data Store Paradigm
(This part first appeared in a longer form in my trip report from the DATAVERSITY Graphorum 2019 Conference).
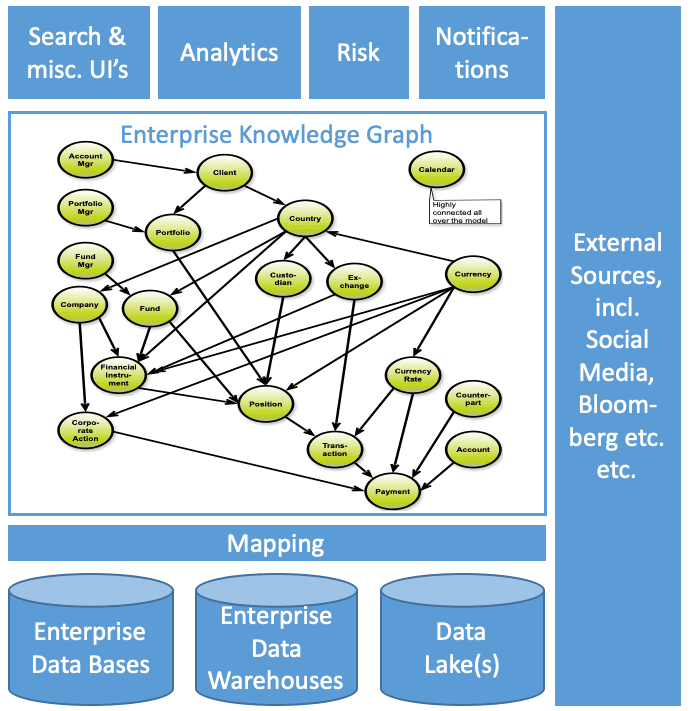
The Knowledge Graph idea is spreading like fire on dry summer days. Building a graph representation condensing the operatively most important concepts and using that as an integration vehicle, linking the graph to other data stores, like operational data, analytical data and even external data is such an attractive opportunity for creating new opportunities for pushing information to a place, where business information consumers can pull whatever they need. A Knowledge Graph can also initiate notifications etc. based on signals from the real world (such as ticker tapes, news feeds etc.).

The traditional “semantic web” technologies (RDF, OWL etc.) vendors have all adopted the Knowledge Graph label. However, there are also many people actively building knowledge graphs based on property graph technology. And that is also a desirable solution in contexts where time to delivery is more important than precise semantics. I know, from practical experiences that a good solution can be delivered in a relatively short time period.
In 2020 we will see use cases of Knowledge Graphs that essentially are “operational data stores”. Only now with well-supported semantics and modern integration and data sharing technologies.
The Eyes Have It!
Data Models are vehicles of human communication. 80 % of our cognition is visual. I am currently studying this book: Mind in Motion: How Action Shapes Thought by Barbara Tversky (prof. emerita in psychology at Stanford). Here is a first recap of some of her findings as bullet points describing her “Nine Laws of Cognition”:
- There are no benefits without costs
- Action molds perception
- Feeling comes first
- The mind can override perception
- Cognition mirrors perception
- Spatial thinking is the foundation of abstract thought
- The mind fills in missing information
- When thought overflows the mind, the mind puts it into the world
- We organize the stuff in the world the way we organize the stuff in the mind.
Read the book! Motion and spatial thinking! The eyes do indeed have it.
In the well-established data modeling communities, visual modeling tools have strong traditions. Think ERWIN, PowerDesigner and many others in the relational space. And think Enterprise Architect and many others in the UML/object space. Finally think Eclipse, TopBraid, Poolparty and many other in the semantic space. Many of the above are somewhat over-engineered, if you ask me.
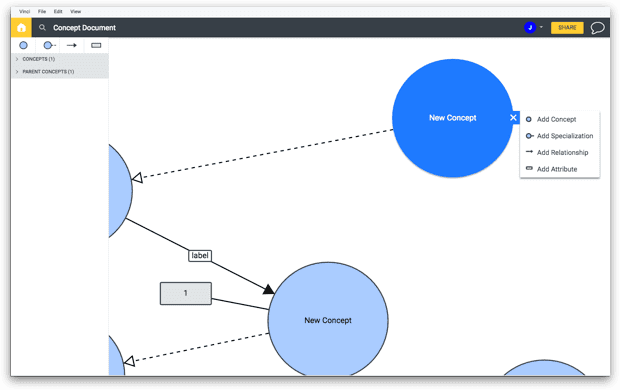
But times are a-changing. In the semantic and property graphs things are moving. Look for example at PoolParty in the semantics space. And look at gra.fo in the graph space (both worlds). Crisp, modern UI’s, such as this snapshot of a small example in gra.fo:

I maintain the “Graph Data Modeling Hall of Fame” for property graph data modeling. Currently there are 23 vendors in the Hall of Fame. Many of them are just visualizing without doing graph “schema editing”. The reason for the latter is that currently property graph databases have very limited schema facilities. One exception is TigerGraph, which has a visual schema editor. The schema feature list is still somewhat limited compared to SQL Classic, but TigerGraph now also offers predefined schemas for different uses cases.
Finally, there is also the Fact Modeling genre, which includes modeling tools such as CaseTalk, see a list of most of them here.
In 2020 there will be a number of new or enhanced (property) graph data modeling tools available. The list includes gra.fo (RDF/OWL and property graph), ellie (conceptual and logical modeling with a touch of graph), Hackolade (the “swiss army knife” of NoSQL data modelling) and Nodeera (Neo4j property graphs).
As soon as the ISO-standard for graph data models and queries are defined in details, there will be an explosion of property graph data modeling facilities. By then, the general, all-encompassing conceptual+logical data modeling paradigm will be that of Property Graphs!
Graph Analytics: Better than AI in Use Cases
In the midst of the AI explosion people tend to forget that there are alternatives, which in some cases are better than AI. That alternative is Graph Algorithms. No “magic”, fully described in mathematical terms (if you care about that), and solving quite a few categories of problems for people at large. No training necessary!
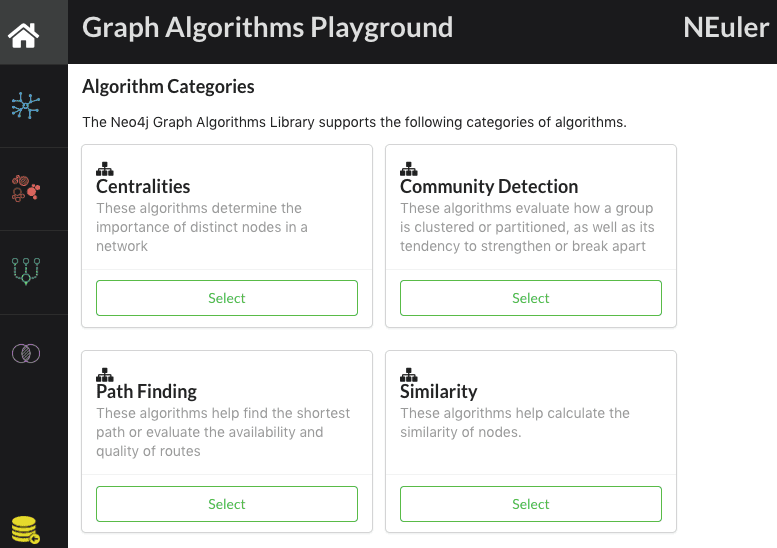
Here is the Graph Algorithms Playground in Neo4j:

There 8, 6, 4 and 5 algorithms, respectively, in the 4 categories. All are parameterizable via forms interfaces.
In 2020 many more people (data scientists, yes, and other) will realize the power of graph algorithms and find ways to use them in combination with AI, ML and applications.
Explainable AI – the Graph Way
Talking about AI: In some important industries like finance, pharma and government, explainability is of essence. The first AI-package that I worked with, was this (in 1986):

Back then (32 years ago), AI was based on relatively simple neural networks. Explainability was, as far as I recall, also an issue.
Today we know how to deal with it by combining graph and AI/ML. This, today, is part of the knowledge graph context:
- AI/ML and good data models have synergetic effects on each other
- Explaining complex relationships is almost exclusively possible using graphs
- Building provenance / audit trails backwards over all steps of the data transformation flows, linking results to original sources and their definitional metadata, is almost also only possible using graphs
- Predictions and the like are by themselves good input for yet another round of AI/ML modeling, learning from your previous results – much easier to pinpoint the exact context in a graph.
So there you have it: In 2020 many data scientists and other clever people (including data architects and modelers) will build knowledge graphs describing the solution space and the lineage trails of their AI/ML models and their results.
The New Black: Semantic Modeling 2.0
My last blog post in 2019 was about the convergence of graphy kinds of data models (Data Modeling on the Other Side of the Quagmire). It concluded with this map of what you could well call semantic modeling:

But some in the semantic communities will claim, with some right, that they have been doing semantic modeling most of the time. And the fact modelers will chime in. So will the property graph modelers, once there is an official standard for property graph models.
Shouldn’t we call 2020: “The Year of Semantic Modeling 2.0”? I think so.
Automated Data Catalogs
Just a small reminder about using automated data catalogs. In 2017 I wrote about it: Artificial Intelligence vs. Human Intelligence: Hey Robo Data Modeler! Since thenI have been watching the space and I have been hearing from use cases in various industries.
It is really hitting the Main Street: In 2020 using automated data catalogs will evolve into best practice. I particularly fancy those kinds, which involve “internal crowd sourcing” as well as a graph based repositories, needless to say!
Breaking News: Computing – A Human Activity!
I started at the University of Copenhagen in 1969. My professor was Peter Naur. He was in many ways an unusual man and a very deep thinker. It is only now in the recent years that I realize how much he has influenced my thinking. 1969 was his second year as professor. He had met computing pioneers such as Howard Aiken at Harvard University and John von Neumann at Princeton, but his original field was Astronomy.
Peter Naur is best known for things like:
- Co-author with Edsger Dijkstra et al on Algol-60
- The “N” in BNF, the Backus-Naur-Form used in so many language definitions
- He did not want to be called a “computer scientist”, he preferred “Datalogy” (still in use today, in Denmark) – the reason being that the two domains (computers and human knowing) are very different and his interest was in data, which is created and described by us as humans
- In his book Computing: A Human Activity (1992), a collection of his contributions to computer science, he rejected the school of programming that views programming as a branch of mathematics
- Computer Pioneer Award of the IEEE Computer Society (1986)
- 2005 Turing Award winner, the title of his award lecture was “Computing Versus Human Thinking”.
In his later years he focused on finding better ways of understanding human thinking, based on psychology, not mathematics.
I hope that 2020 will be a turning point and that many more people will realize that the field of data is a human activity. I will get back to these issues, promise.
That’s it, this was my New Year’s resolution for 2020! I thank you all for reading and I wish you an interesting, successful and humane 2020!
PS. Did this post strengthen your interest in graph data modeling? Well, there are online courses available to you here!
