Click to learn more about author Thomas Frisendal.
Trip Report From Graphorum / Data Architecture Summit 2019
On October 14th thru 17th Chicago hosted the two co-located conferences Graphorum and Data Architecture Summit 2019 by DATAVERSITY®. It was two days of good tutorials and two good days of conference presentations.
One thing to think about is that out of 135 presentations, 68 were in the Graphorum tracks. Being a graph fan, I am, of course, happy about this. Graph is leaving a larger and larger footprint. And that is good. Most of the presentations that I attended were graph ones, and in consequence, this trip report has a clear graph bias.
To Be or not to Be a Knowledge Graph
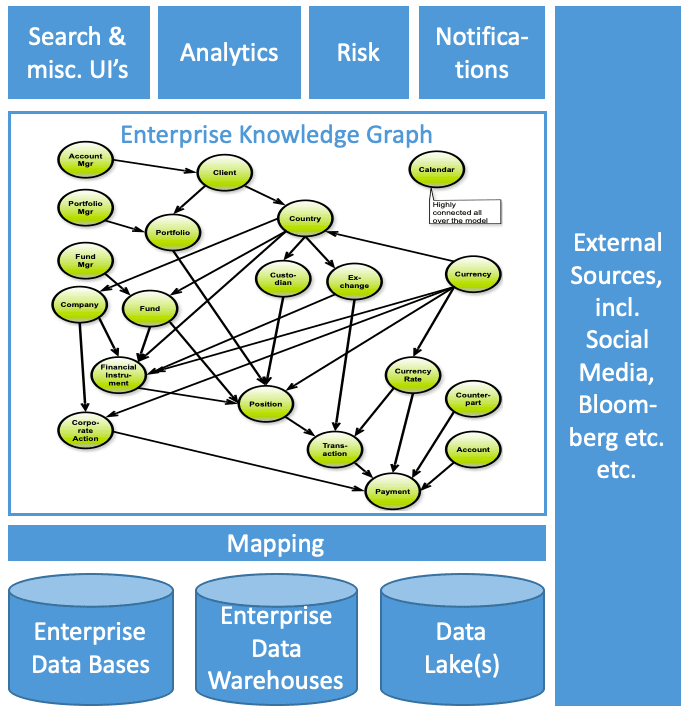
The Knowledge Graph idea is spreading like fire on dry summer days. Building a graph representation condensing the operatively most important concepts and using that as an integration vehicle, linking the graph to other data stores, like operational data, analytical data and even external data is such an attractive opportunity for creating new opportunities for pushing information to a place, where business information consumers can pull whatever they need. A Knowledge Graph can also initiate notifications etc. based on signals from the real world (such as ticker tapes, news feeds etc.).

Sketch of a financial institute knowledge graph (TF)
Text integration, again using knowledge graphs as the facilitator, was also much talked about. Using text processing technologies and distributing the extracted information, linked to the basic business concepts (like Customer, Product etc.).
The traditional “semantic web” technologies (RDF, OWL etc.) vendors have all adopted the Knowledge Graph label. And precise semantics is indeed a desirable quality for complex contexts, which is the position I have always had since RDF came on the market roughly 20 years ago.
However, there are also many people actively building knowledge graphs based on property graph technology. And that is also a desirable solution in contexts where time to delivery is more important than precise semantics. I know, from practical experiences that a good solution can be delivered in a relatively short time period.
I could not help thinking that the knowledge graph is the “operational store” as it should have been. Now with well-supported semantics and modern integration and data sharing technologies.
Full-Scale Data Modeling Using Graphs
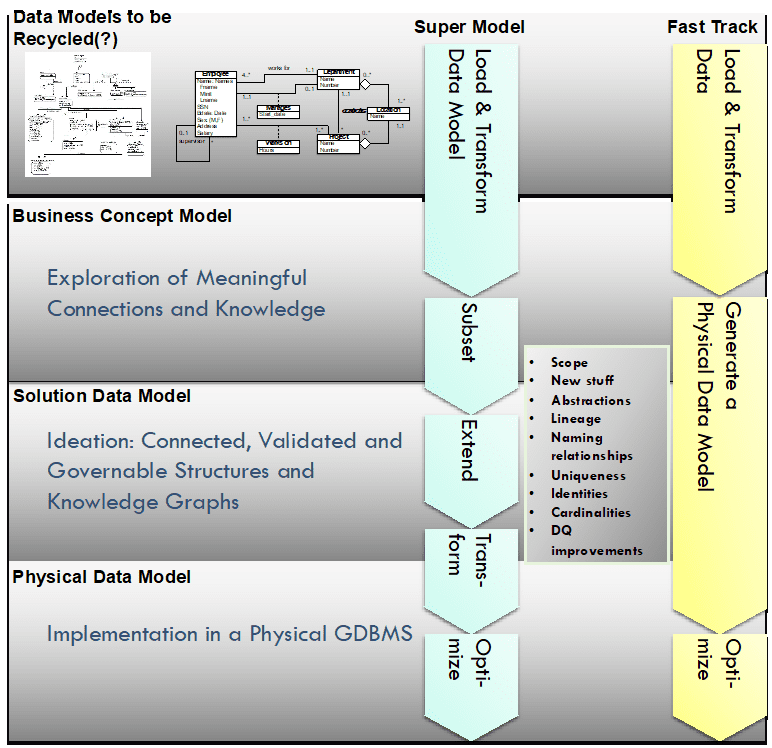
That was the title of my conference presentation, where I emphasized the different contexts and concerns that modern enterprises have. There is a sliding scale from strictly controlled and governed use cases (like in government, pharma and finance) to agile and even opportunistic data lake approaches, where time to delivery is most important. And there is also a “push vs. pull” concern between pushing refined data products and pulling information from the other end of the food chain. I defined two Data Modeling approaches: Super Data Models vs. Fast Track Data Models.

Control vs. Flexibility in Graph Data Modeling (TF)
This is also the line of thinking that goes into my newly published Online Learning Plan at DATAVERSITY: Modeling Data as Graphs.
The DATAVERSITY Training Center is growing fast; new titles are being added in several areas.
Other Data Modeling News
Semantic modeling was a theme in many of the presentations. Ontologies are finding ways to be easier to model, and generally there are fewer concepts than there are entities and attributes.
I was pleased to see Datastax Graph – positioned for the “relationship-first revolution”. I could have said that!
Hackolade strengthened its position as a visual Data Modeling tool for NoSQL with new / improved support for property graph databases: Neo4j, Amazon Neptune and Tinkerpop.
Factgem has a “Whiteboardr”, a business oriented, visual Data Modeling tool. Way to go!
And I am sure there could have been more. But I did not notice any other Data Modeling breaking news.
But there was a new database product: Terminus DB, “… implementing a closed world version of OWL”. Interesting takes on many topics. “Structured, semantically meaningful data for rapid delivery of data driven applications. Join the data-centric revolution!” Indeed.
Property Graph Convergence
Semantic Graphs, Property Graphs and SQL Property Graphs are becoming close friends.
One of the first-time speakers (but definitely an experienced one) at the conference was Keith Hare, who has participated in the SQL Standards committees since 1988 and has served as the convenor of the international standards committee ISO/IEC JTC1 SC32 WG3 Database Languages since 2005. Keith introduced some of the current directions including adding support for property graph queries within SQL (SQL/PGQ) and a proposed standard for a declarative Property Graph Query Language (GQL) that builds on foundational elements from the SQL Standards such as data types, operations, and transactions. This was extremely well received by the audience, and I am proud to be able to say that I will contribute to the work, being the appointed person from my home country of Denmark. Exciting times!
It is also exciting that the RDF-world and the property graph world(s) are getting closer. A good example is the emergence of RDF* and SPARQL*, which aim to reduce the structural differences between the two worlds. Properties on relationships is a good example of this.
Convergence was mentioned several times and I expect the area to grow fast over the next few years.
Graph Analytics and Algorithms
There was lots of talk about AI and ML, of course. But also on graph applications. In my opinion they are very powerful tools, which can perform many of the tasks that people are training ML/AI models to generate solutions to. Important to keep this in the back your head.
My First Panel Session
This conference was a first for me. DATAVERSITY was kind enough to ask me to participate in the closing panel – titled “Graphs or Tables”. Although we panelists disagreed on small matters, we agreed largely on the better phrase being “Graphs and Tables”. One size does not fit all, and adding graph functionality to a subject area is a great way to create new business opportunities and add value. Nice session – thanks to the panelists and the audience!
Data-Centric vs. Application Centric
One of the best forward-looking presentations was Dave McComb’s tutorial “Data-Centric, Models and Architectures”. I like his thoughts about the need to leave the application-centric contexts that many people take for granted today. Only better, easier and truly business-facing data models can take us into the Data-Centric phase; we are not quite there, yet.
By the end of the tutorial, Dave held a little raffle over his book “Software Wasteland”. Guess who the luck winner was? Yours truly! I have been wanting to read this book since he published it last year. I also want to “know what’s causing application development waste so you can turn the tide”. I will get back to you on this!
Wrap-up
Good conference(s)! Lots of good talks during the breaks etc.!
And good directions: SQL, property graph, semantic graphs convergence; Knowledge graphs from wall to wall!
