Click to learn more about author Thomas Frisendal.
I seriously believe, and I also know from professional experiences that Design Thinking is the secret sauce for creating high quality Data Models. This sounds contra intuitive, so we will have to do some debunking:
”Design Thinking – isn’t that for designing good looking products, like watches, cars or furniture?”
No, it is not about aesthetics. It is about creating coordinated changes to a business by way of psychology and experimentation.
Danish Design by Arne Jacobsen / Fritz Hansen
“Data Models are not design objects; Data Models reflect the real world and represent it as an abstraction.”
Yes, they do, but the world is a moving target, and many a time we need to change the agreed perception of reality. You ought to shout “disruption” here! As a matter of fact, business management is a whole lot about change management. If the business aims to change processes or data that is what we must do. But how do we go about that?
I have been combining design thinking with concept mapping since around 2001. The success rate has been overwhelming. I have trained several hundred people in the techniques. And I am happy to see that other consultants have found their way into it. Teradata, for example did a webinar and a report together with TDWI: “Use Design Thinking to Unleash Creativity in BI and Analytics Development.”
First of all, the biggest challenge in Data Modeling is communication of structure and meaning to the audience, who are people, not machines, going all the way from business people to developers and database admins. It is a people problem, so let us solve it using:
Perception and Cognition
Our audience is business people and developers (also people), so we need to know how people perceive and work with recognized information. The expertise in these matters come from the realm of cognitive psychology and cognitive science in general.
Cognitive psychology comprises areas of research such as categorization, knowledge representation, language, memory, perception and thinking.
From the cognitive researchers we can pick up a number of paradigms, which have proven to work.
Concepts matter. Psychologists specialized in learning and teaching have developed the technique called concept mapping, which is used in both elementary and higher levels of education with very good results. It is a visual structure that is easy to communicate. A good place to host the user stories, which we need for determining the requirements of the business.
Cognition is spatial. There are strong indications that the way our perception and recall work is derived is from our innate capabilities of visually processing our environment. In other words, spatial structures are what we are talking about. On one side this points in the direction of visualization. And on the other side it implies working with what is similar to multidimensional coordinates. Conceptual spaces are a good word to search for on the Internet.
Semantics are important. Since around the year 2000, technologists (called semantic web nerds) have worked with implementing Semantic Technologies. At the time of this writing the field is blossoming with brand names running their business on top of Semantic Technologies. If in doubt, find out what Knowledge Graphs are about and try it out for yourself.
Cognitive Computing is here. Not only Knowledge Graphs and Machine Learning packages but much more integrated solutions are now readily available from Silicon Valley and elsewhere.
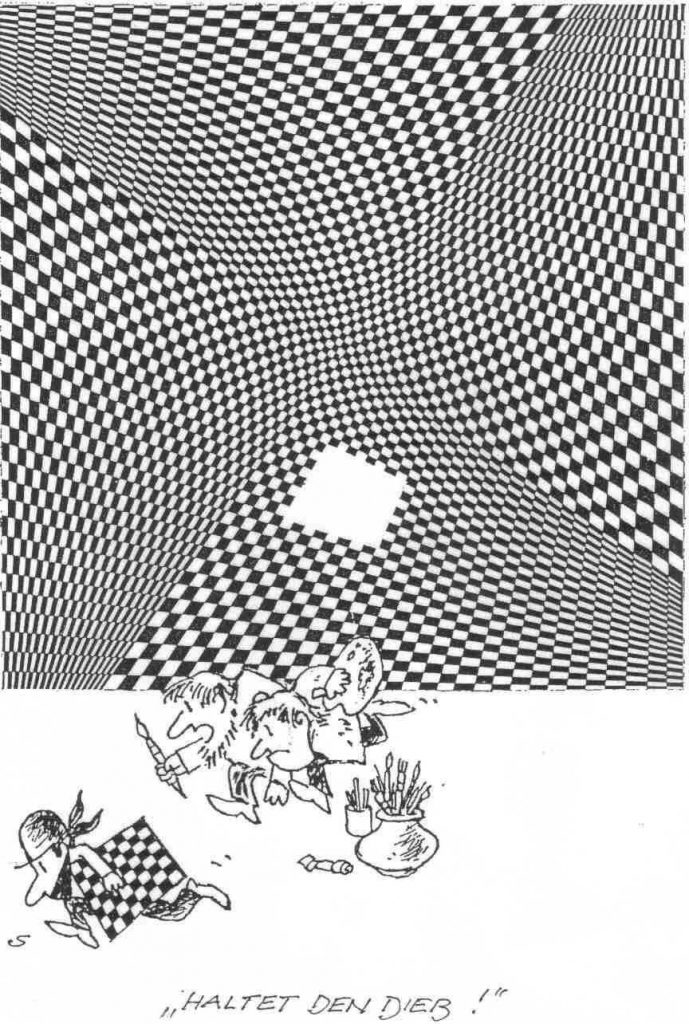
Here is a visual deception:
“Haltet den Dieb!” means “Stop thief!” in German. The cartoon is by Heini Scheffler, CC BY-SA 3.0 (http://creativecommons.org/licenses/by-sa/3.0), via Wikimedia Commons, (https://commons.wikimedia.org/wiki/File%3ASchachBrettDieb.jpg).
Powerful communication can be established using the right brain’s physical senses. We are around 80% visual in dealing with our surroundings, so using visualization is a must. Brains are built, not least, for navigation. That is why structured representations in 3-dimensional space are most effective. And learning is enforced by organized information (according to the findings of educational psychologists).
Let me re-emphasize visualization. I am using concept maps (not mind maps).
Concept Maps
Concept Mapping comes from learning psychology and has been proven to be a tool well-suited by business people (look up researchers like Moon, Hoffman, Novak, Canas, and yours truly).
Concept Mapping deals with people, language and meaning, not engineering. Learning from the business what the business is doing, and where it wants to go is a people issue. It involves brainstorming workshops, mapping the language of the business and getting the meanings right.
The “as-is” situation is not well defined (and it is fragmented, and it is redundant, and …) and it may need some rework on the fly. Finding out where the business wants to go is also learning. Very much so, as a matter of fact.
Concept Mapping is intuitive visual communication and has proven to be highly successful in business analysis. Conceptual Modeling (UML and Entity-Relationship diagrams) failed as a business-side tool, but concept mapping coming from educational psychology is readily accepted in the business communities.
Contrary to common wisdom, business analysis is not “just a documentation issue”. It is a learning process both for the analyst, but also for the business itself. Concept Mapping works in this context because it is based on psychology (the theory of meaningful learning), not on an engineering mindset.
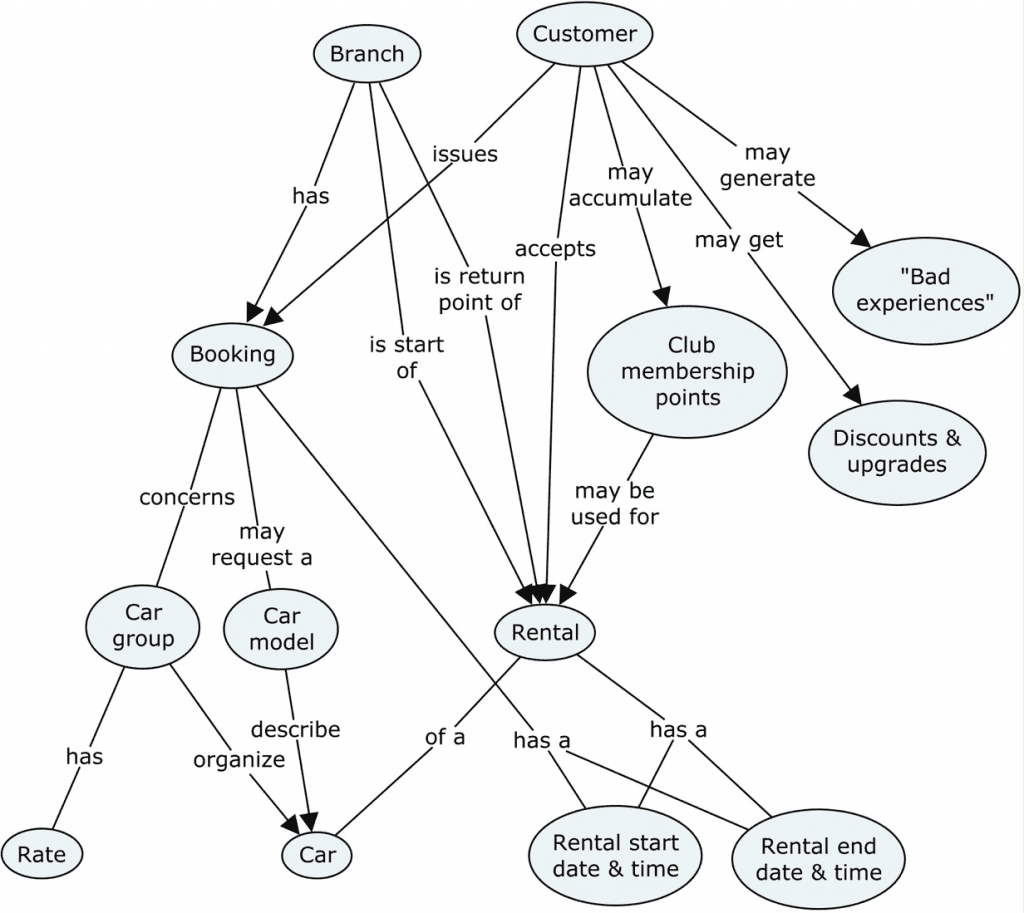
See for yourself:
The diagram is a Concept Map, and it really speaks for itself, which is the whole idea. Notice that you can read little sentences like “Customer issues Booking” and “Car Group has a Rate” and so forth. The sentences are visual, they are the connecting lines between the concepts. Concept Maps can be drawn easily in brainstorming style workshops and they are easy to maintain, also for non-technical users.
Concept Maps were originally designed and developed by Professor Joseph Novak (Novak 1990, 2008) with a learning focus. The theory behind concept maps is based on Professor D. Ausubel’s theory of meaningful learning, which suggests that learning is based on representational and combinatorial processes, which occur when you receive information.
In summary: there are two processes: Discovery (of information) that leads to Reception of the information, integrated with what the learner already knows. In this manner Concept Mapping is not only facilitating learning, but also creativity.
And that brings us to design thinking!
Discovering Business Level Concept Maps
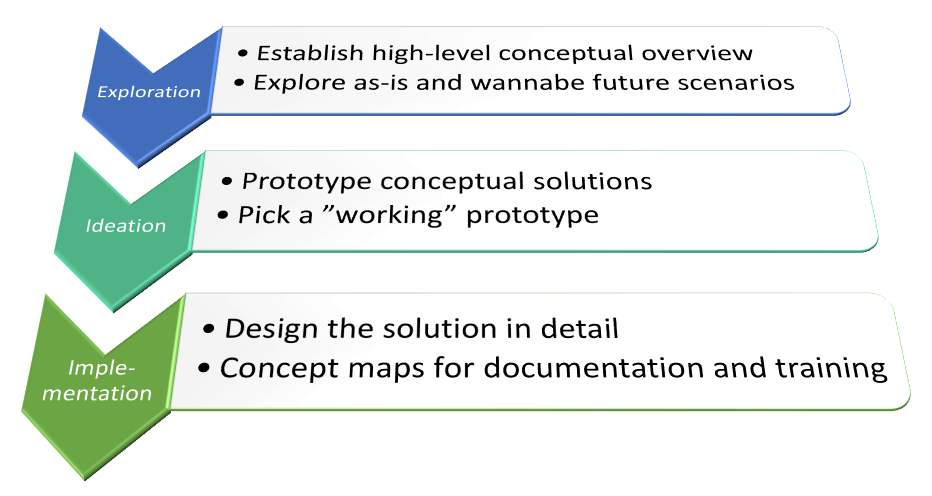
Design Thinking in general is a 3-step process: 1) Exploration, 2) Ideation and 3) Implementation.
In the Data Modeling (analysis and design) context you follow the principles from Design Thinking.
- The “explorer” (modeler) works on the conceptual level, mapping his/her findings using Concept Maps as new concepts are discovered. The knowledge is elicited from business people by way of brainstorming (typically as a top-down analysis) and/or by bottom-up “archeology” working from legacy databases, documentation, reports etc.
- The “ideator” (modeler) creates, iteratively, some “working prototypes” (still just concept maps), and the business decides which solutions, they prefer. This is a very creative stage with a lot of “Aha” moments and “We’ve got to change this” decisions…
- A solution is refined and finished up for completeness / scope / terminology / availability etc.
Building a Solution
The next steps are the transformations from a (collection of) Concept Maps into a logical, solution oriented data model.
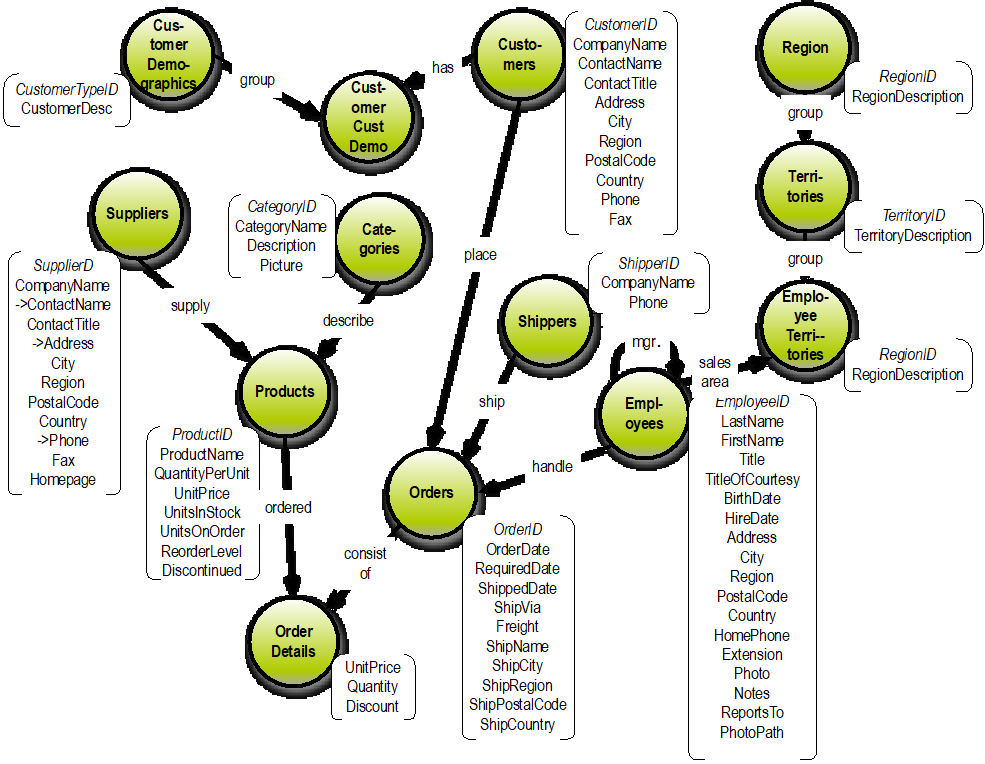
Since the Concept Maps are directed graphs already, a logical model can easily be built in the property graph paradigm, which is very popular these days.
From a logical property graph it is relatively trivial to derive Graph Data Models (of course), but also aggregate designs for key/value stores and even SQL table designs fall out easily.
Attacking the business level understanding with both psychology (visualization etc.) and design thinking (more psychology as e.g. empathy and brainstorming) leads to very high levels of model quality and business alignment.
The transformations from concepts to object types and relationships and further on to physical types is engineering as we know it.
The whole thing can be done with short delivery times. A one-page Concept Map is doable in a sprint.
This is the backbone what I am doing:
Design Thinking -> Business Analysis -> Concept Mapping -> Data Modeling
Should I call this flow “Disruptive Data Modeling”? I think not, it is just techniques about how to get things done right, and fast. It is data-driven user stories, if you ask me.


