Click to learn more about author Steve Miller.
One of the major benefits of working with R and Python for analytics is that there’re always new and freely-available treats from their vibrant open source ecosystems. And now more and more, data scientists are able to reap the benefits of working with data in R, Python and other platforms simultaneously, as vendors introduce performant products with APIs to both R and Python — in addition to perhaps Java, Scala and Spark.
An example with which I’m currently quite smitten is H2O. H2O brands as “AI for Business” that “makes it possible for anyone to easily apply math and predictive analytics to solve today’s most challenging business problems.” What sets H2O apart is its comprehensive, open source, cross-platform, machine learning infrastructure architected from the ground up for scalability and speed.
I’m actually just now putting the R H2O server through some ML paces and like what I see so far. Modelling challenges that have brought R to its knees in the past are being handled with aplomb by H2O.
One such illustration of H2O’s modeling capabilities in a supervised learning, regression context is detailed below. The data set used in the examples derives from a 2010-2014 aggregation of a American Community Survey sample from the United States Census Bureau. This data has in excess of 15.5M records and 290 attributes. The curated subset used in the analyses below consists of 8.5M+ cases and 7 recoded variables. Meaty data like this has historically proven scary for R on a Wintel notebook computer.
For this exercise, I deployed R’s data management capabilities to build the model data sets, then “import” into H2o structures for running the models. I could just as easily have used H2O functions.
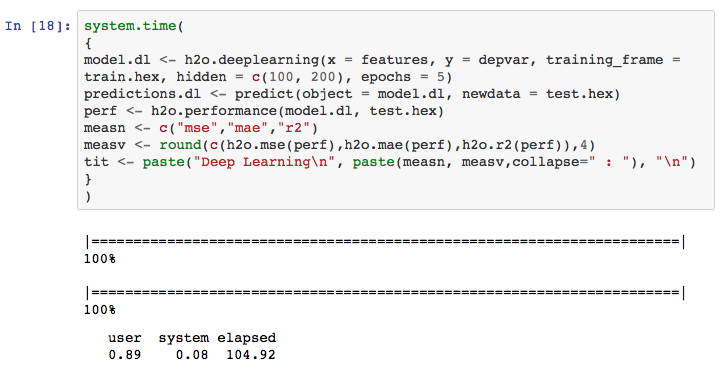
The sequence of tasks outlined starts with data loading and train/test data set builds. The H2O server is then started, computing/graphing the results in turn of glm, glm with cubic splines, gradient boosting, random forests, and deep learning models. Timings are provided for both H2O data set builds and model trainings.
After over 15 years of statistical modeling in R, to say I’m impressed with the performance of H2O is an understatement. I’m excited further to test H2O on Python, Hadoop and Spark. Next month I’ll take a preliminary look at H2O for Python.
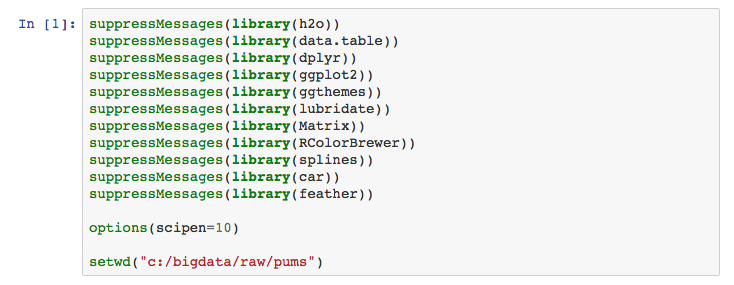
First load the R libraries and set the working directory.
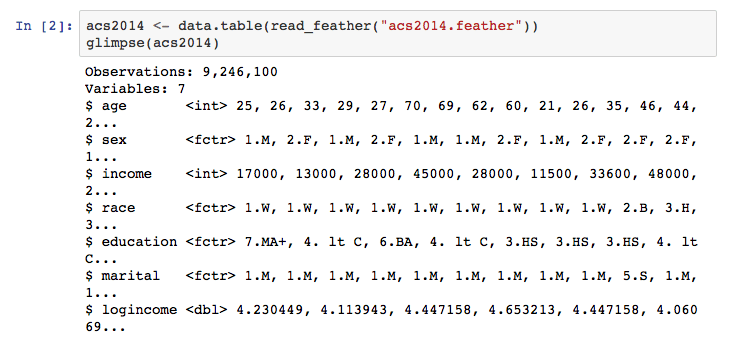
Now load and subset the data used for the modeling exercises. Ultimately, there are 8,644,171 cases and 7 attributes.

The next step is to partition acs2014 into train and test data tables in R. For our analysis, the dependent variable is logincome, while the features include age, sex, race, and education.

Start the H2O server, allocating 16G RAM and using all 8 cores.

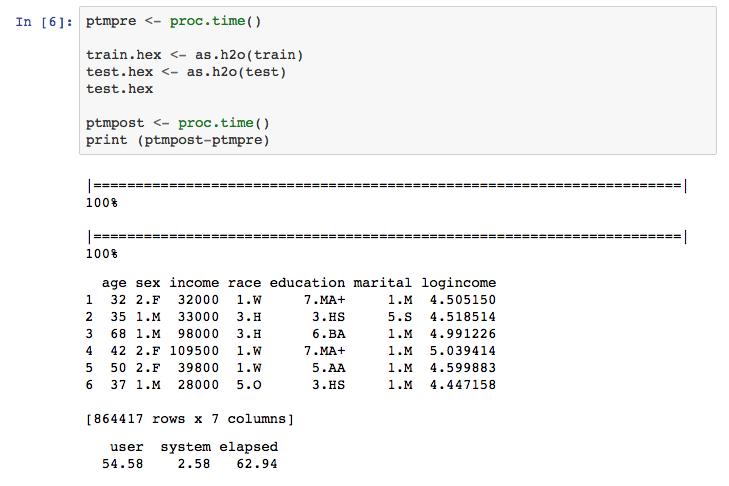
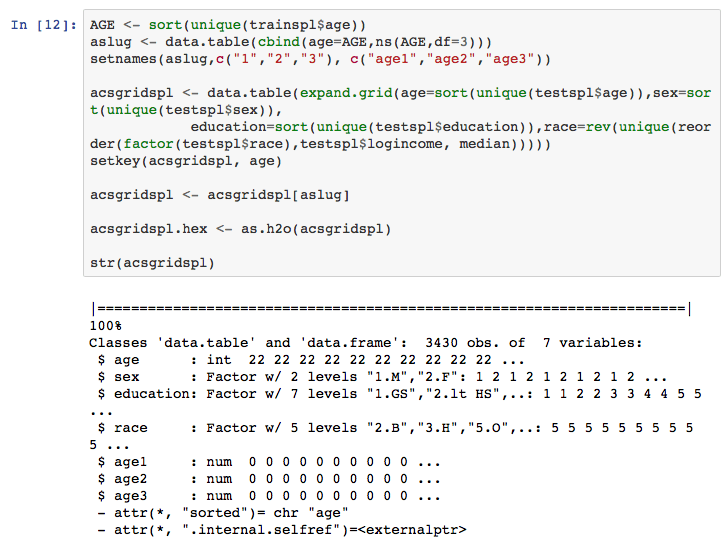
Now create H2O data structures from the R data.tables. We can either do the data manuevering with data.frames/data.tables or work directly with H2O data structures and functions. For this exercise, I work in vanilla R then copy the structures to H2O.
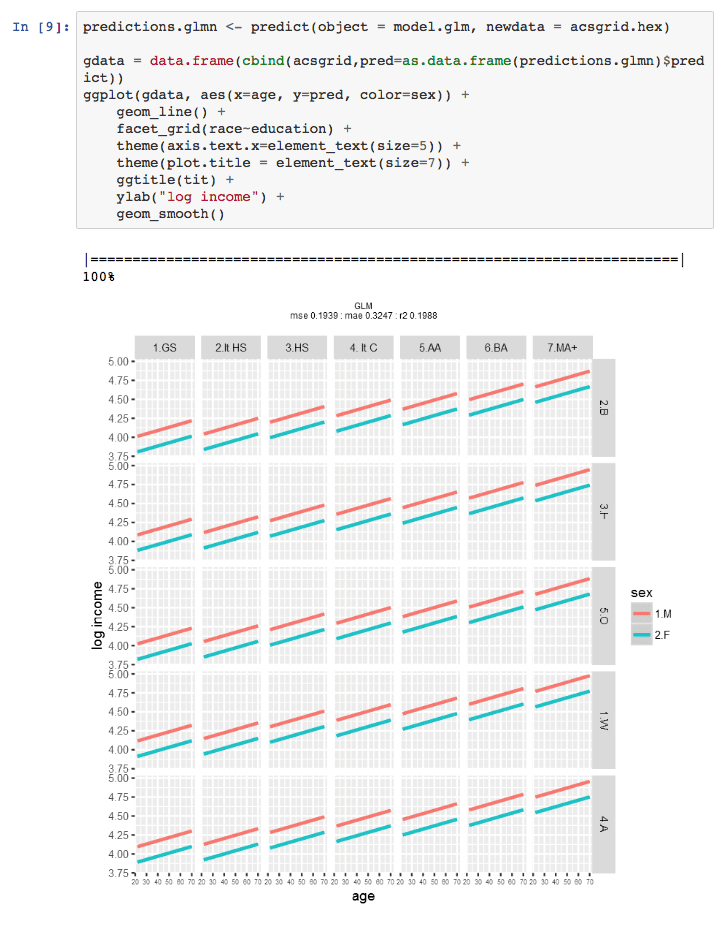
Run the general linear model (glm), regressing logincome on age, sex, race, and education with the training data. Compute predictions with test, assess model performance, and graph the result possibilities with ggplot. In this model specification, logincome increases linearly with age. Notice the speedy performance even with over 7M training records.
The graph is a small multiples of logincome by age, grouped by sex, with top trellis of education, and side trellis of race.



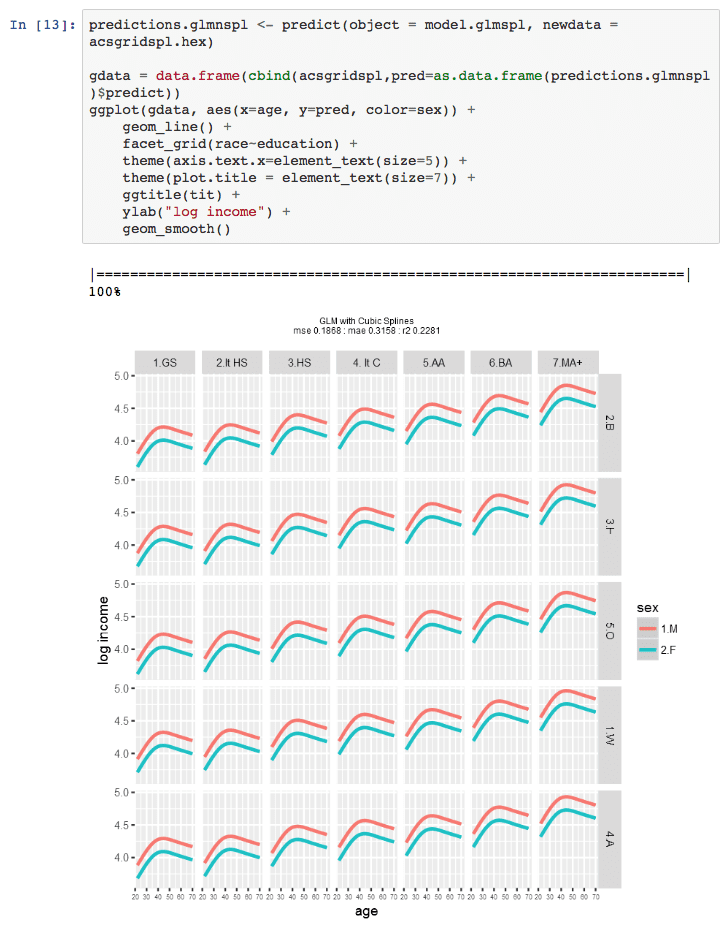
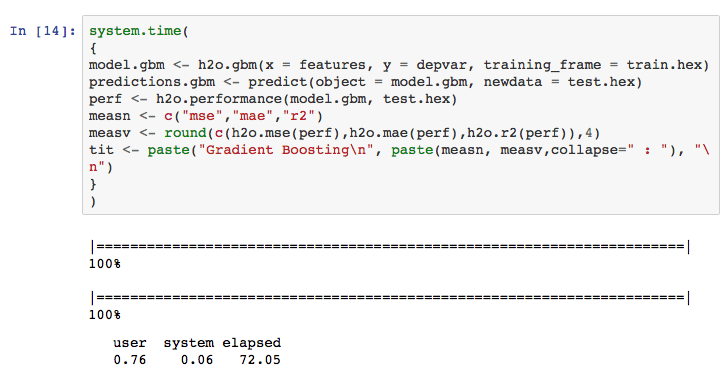

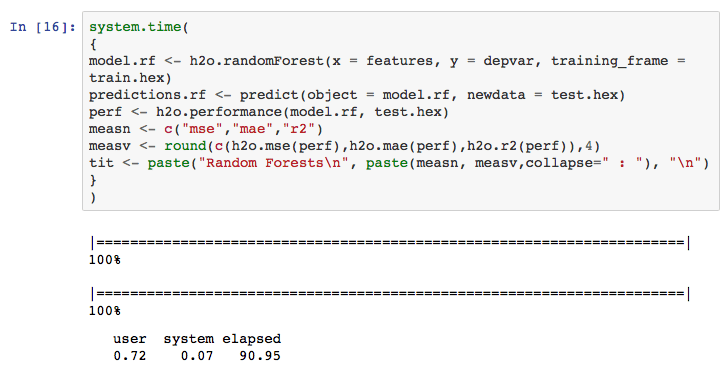

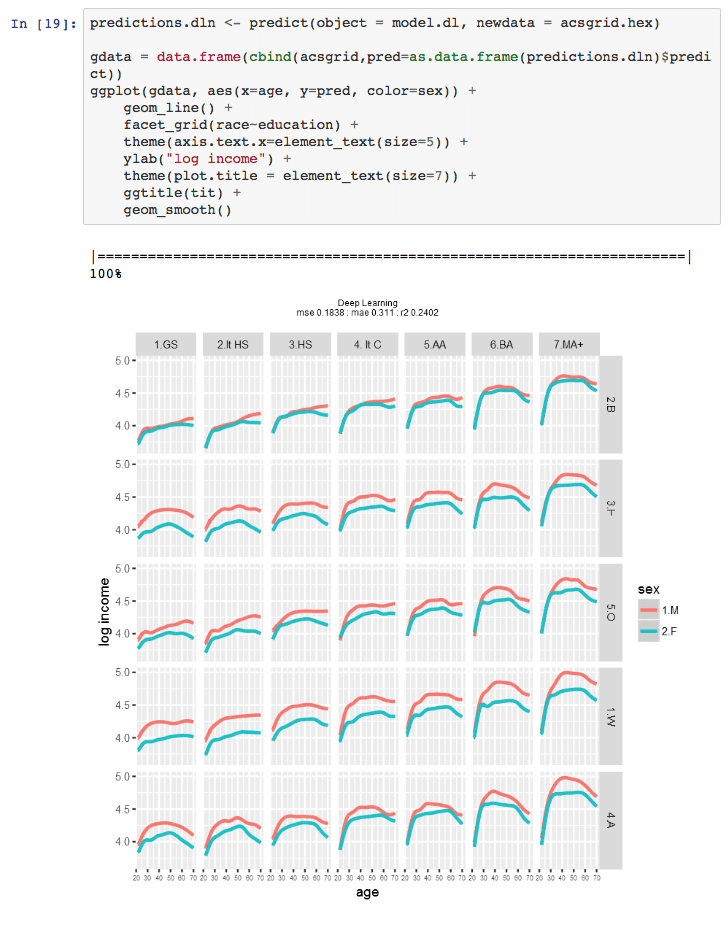
A cursory inspection of model performance suggests that gradient boosting might produce the best results with these data and models. Of course, different train and test data sets would produce different performance.
The larger kudos, though, must be awarded H2O for its positive impact on both the capacity and speed of ML modeling in R. I’m now able to take on challenges in vanilla R that were recently relegated to Spark. Modeling with H2O is fun.
Next month I’ll discuss H2O with Python.
