Click here to learn more about author Steve Miller.
I’ve been programming in Python for almost 15 years. When I started around 2001, I was doing most of my non-statistical work in C and Perl, the early days of Fortran, PL/I, and Pascal thankfully by then long gone. Just as with R for statistical computing, I now like that Python is free open source with a large engaged developer community. I also love that the language is simple and easy to work with. You can pick up the basics quickly – and write productive code that’s both terse and easy to maintain. And there’s plenty of goodies for free from the Python community. Life’s good.
To progress up the Python curve, I developed prototypes to manage similar stock index performance data I’d programmed in the past. Using data sets downloaded from Russell Investments, I set out to analyze portfolio performance and learn a new technology at the same time. I figured it was a win-win.
In first learning Python, I did what most programmers adopting a new language do: simply translate the dialect of the new language to one that’s already known, just to get something working. After that, I figured I’d start to adopt unique Python programming metaphors. In fact, that’s what transpired.
Consider the code snippets in-line below that take an array of end-of-day stock index levels and compute straightforward day-to-day percent changes. The development environment is Windows Python using the Jupyter notebook from the open source Anaconda installation that includes the NumPy and Pandas packages.
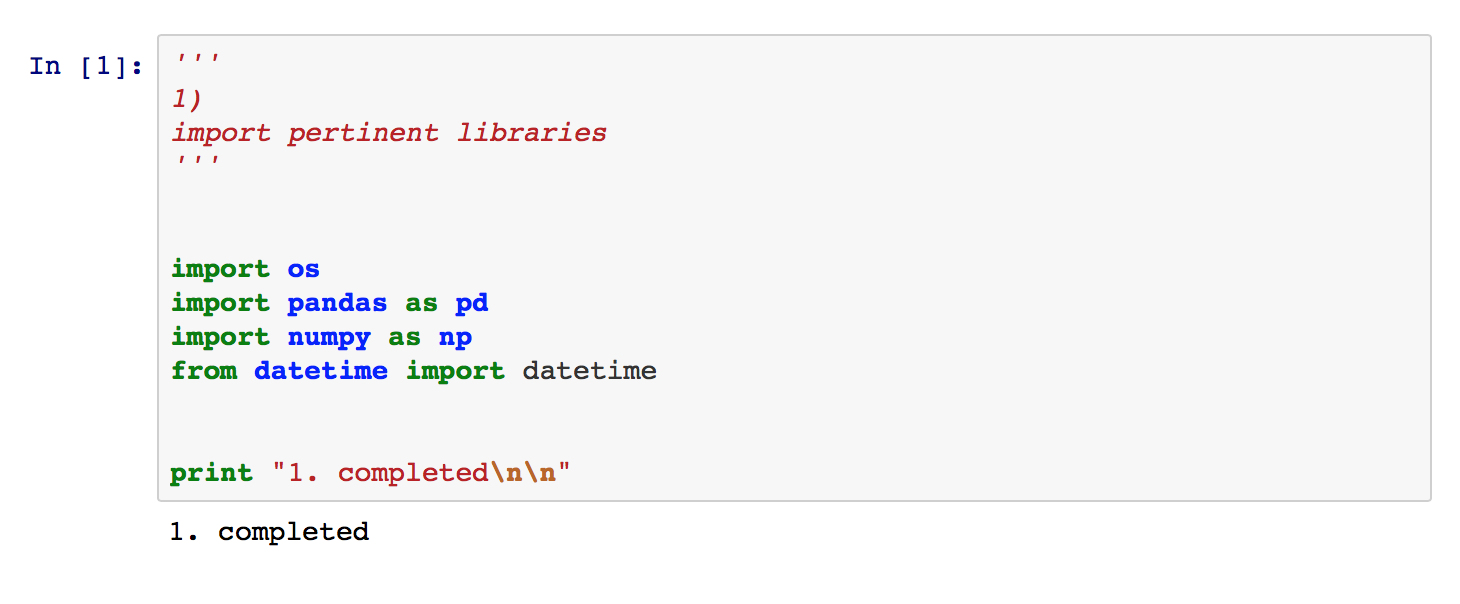
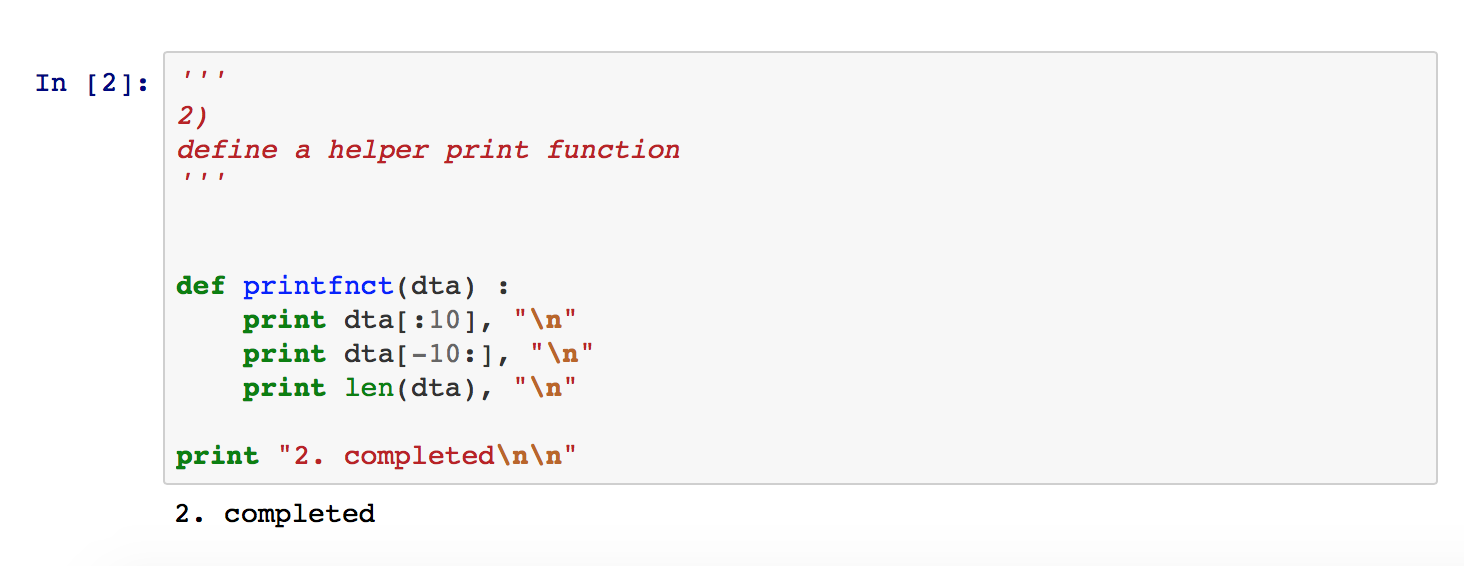
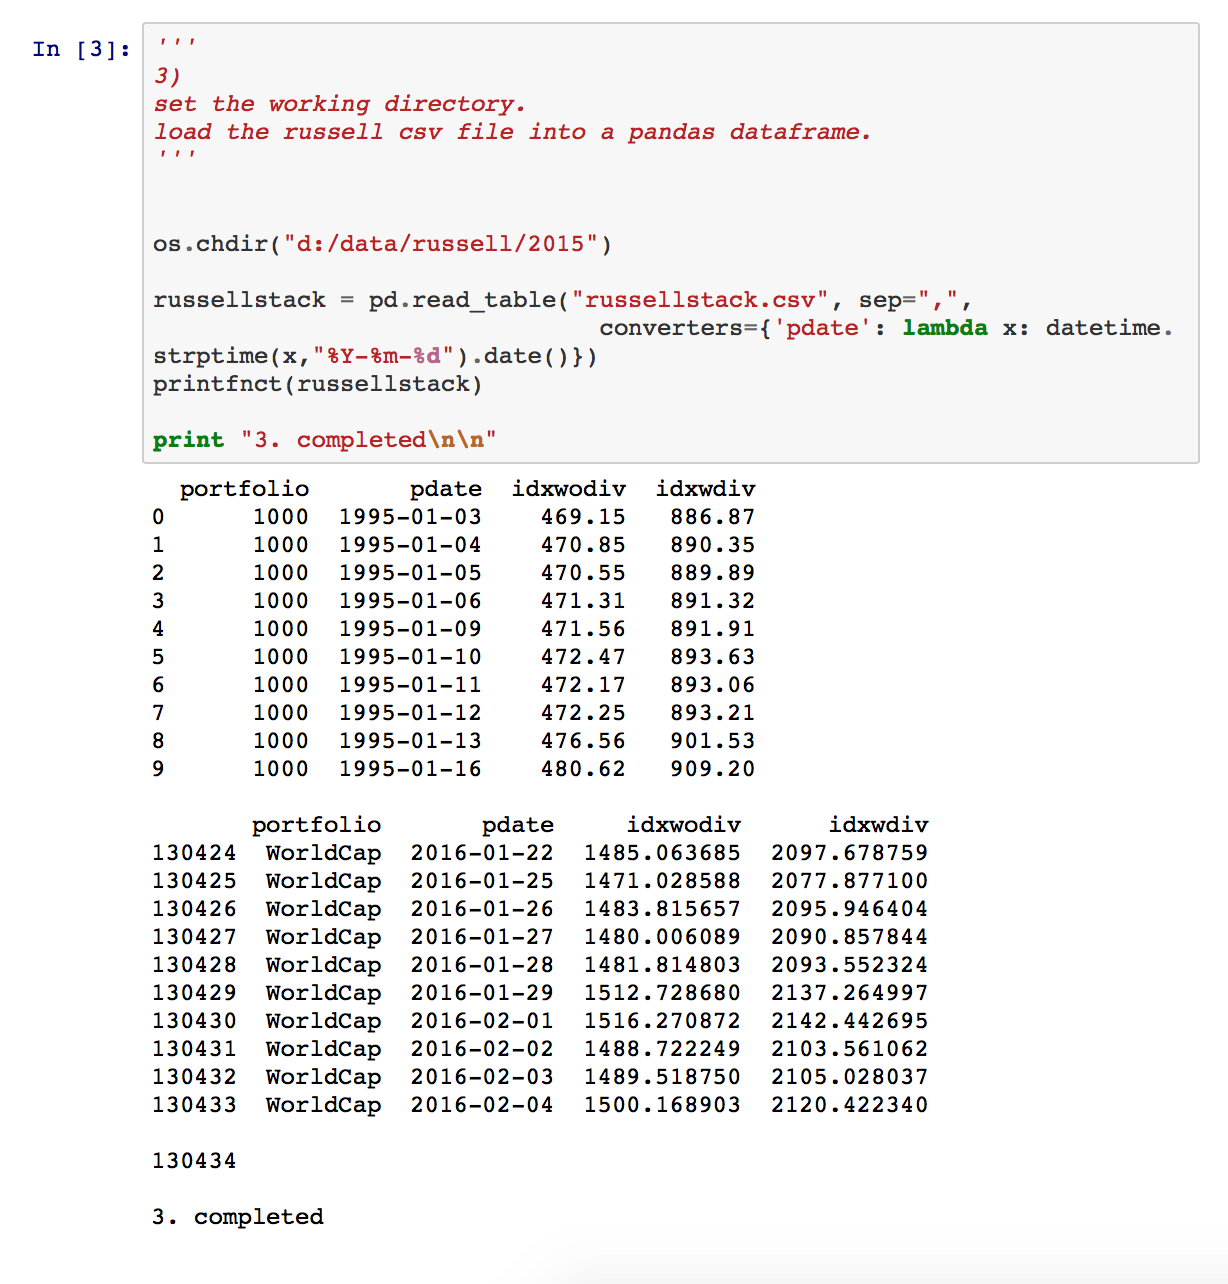
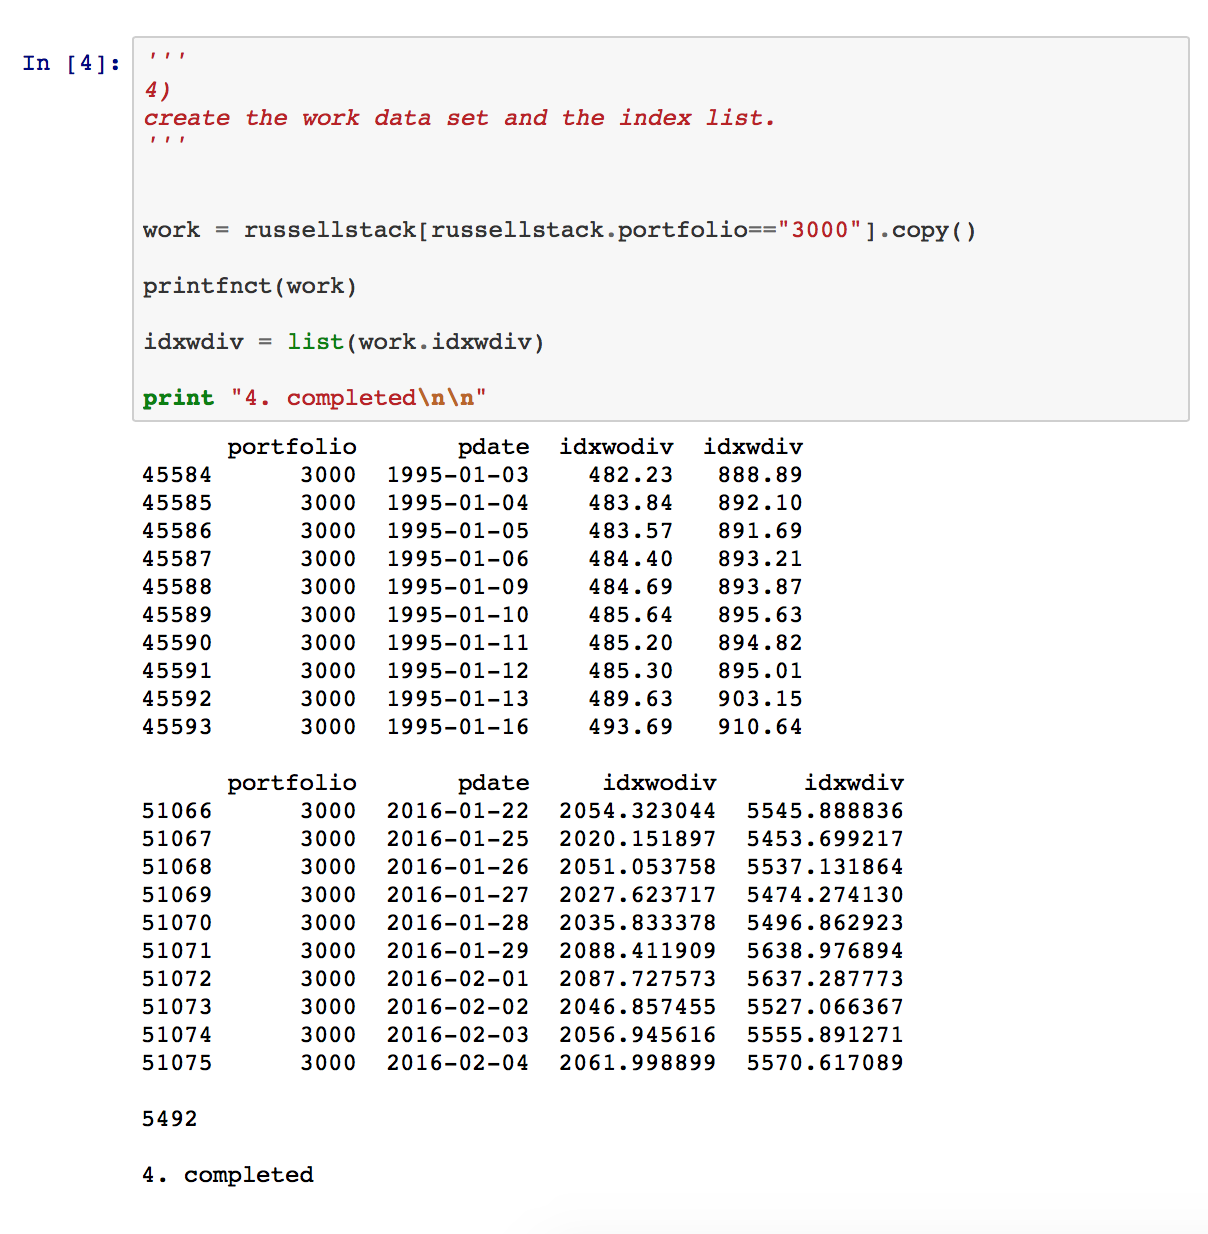
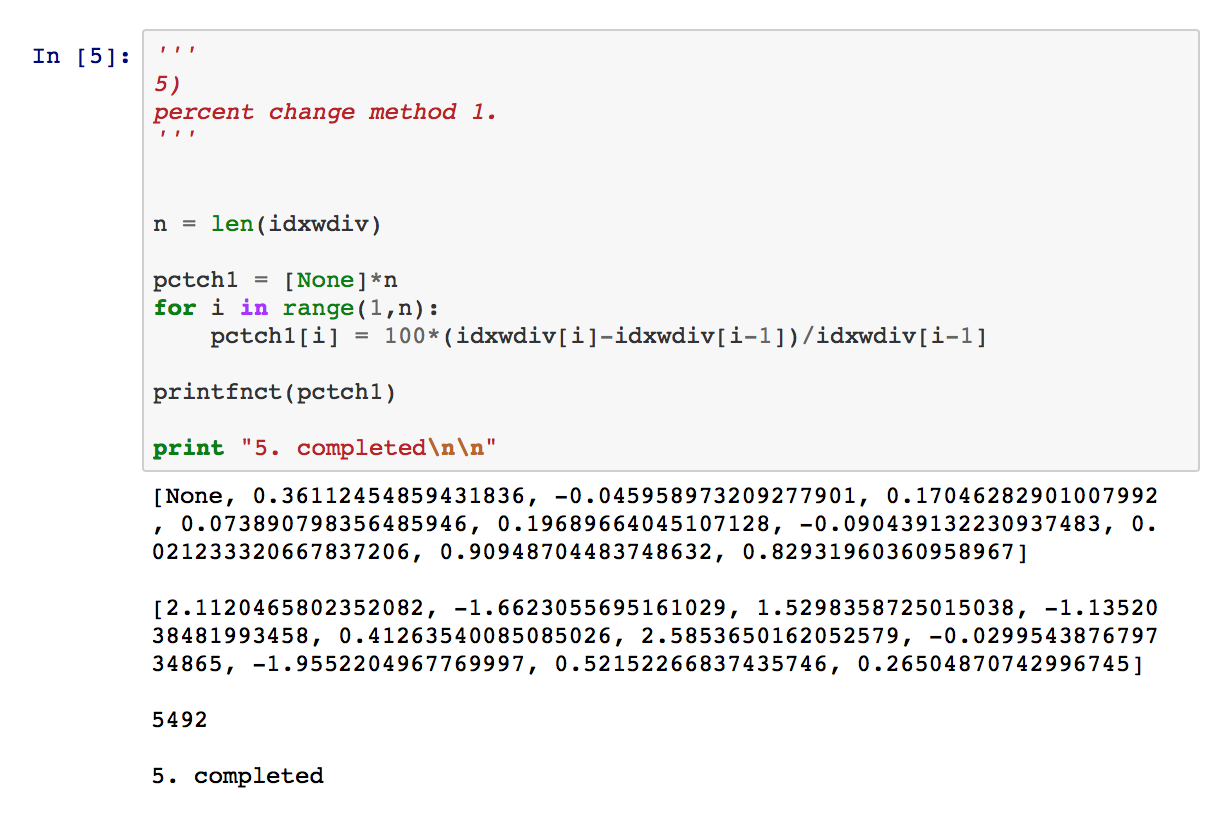
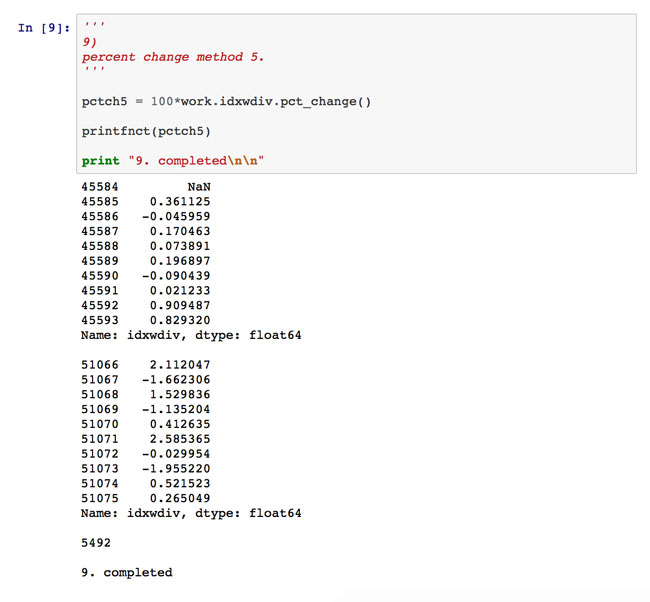
These notebook snapshots illustrate my learning progression. 1) simply imports the Python libraries needed for subsequent use. Note that NumPy and Pandas are both community-developed and outside of core Python. 2) defines a simple print helper function that subsequent steps use to detail results. 3) uses the Pandas library to read a csv file containing Russell index performance data over time. The resulting data.frame attributes include portfolio name, date, and two end-of-day index levels: one without dividends re-invested and one with. A Russell 3000 index subset including a stand-alone list of index values is created in 4).
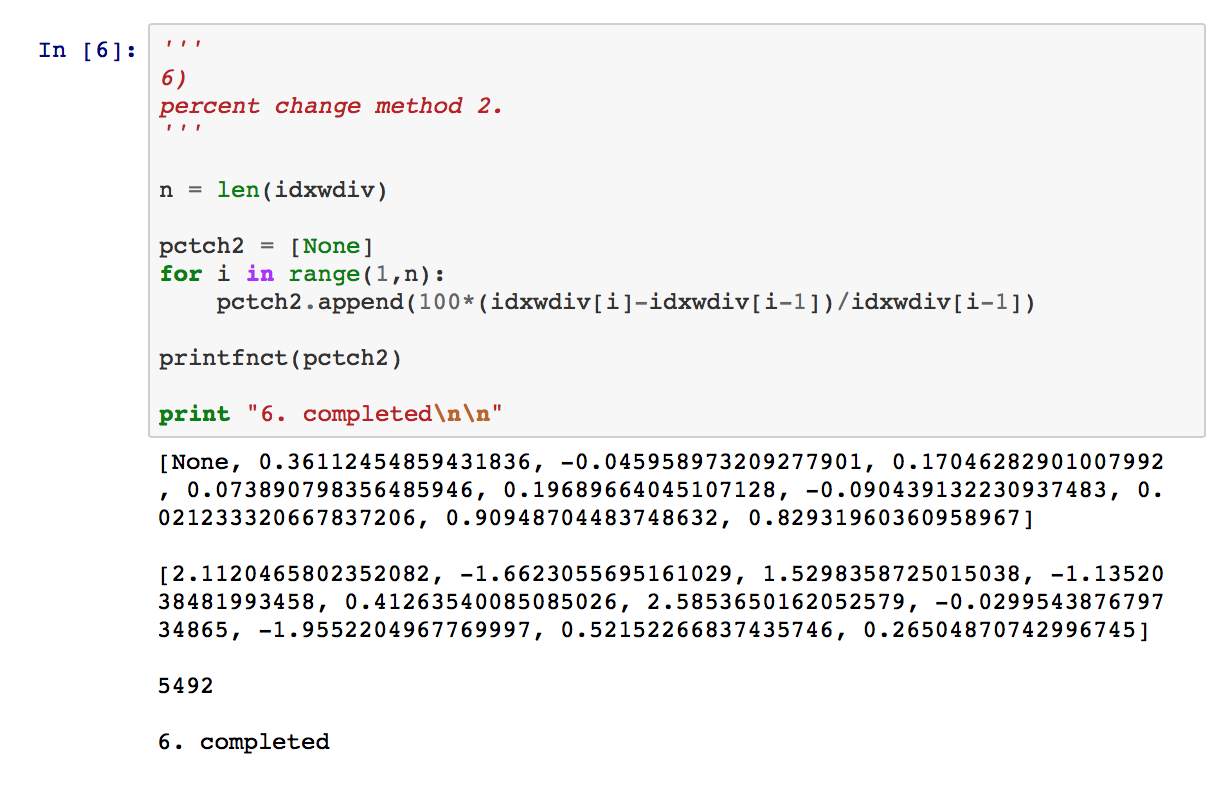
5) details code to compute percentage changes I might have written circa 2001. First, I “allocated” an array to hold the pctch calcs, then looped through the index values list to perform the computations and insert them into the array. The code is not unlike something I’d programmed in C or Pascal years earlier. 6) is pretty much the same as 5), though it’s more Python-like.
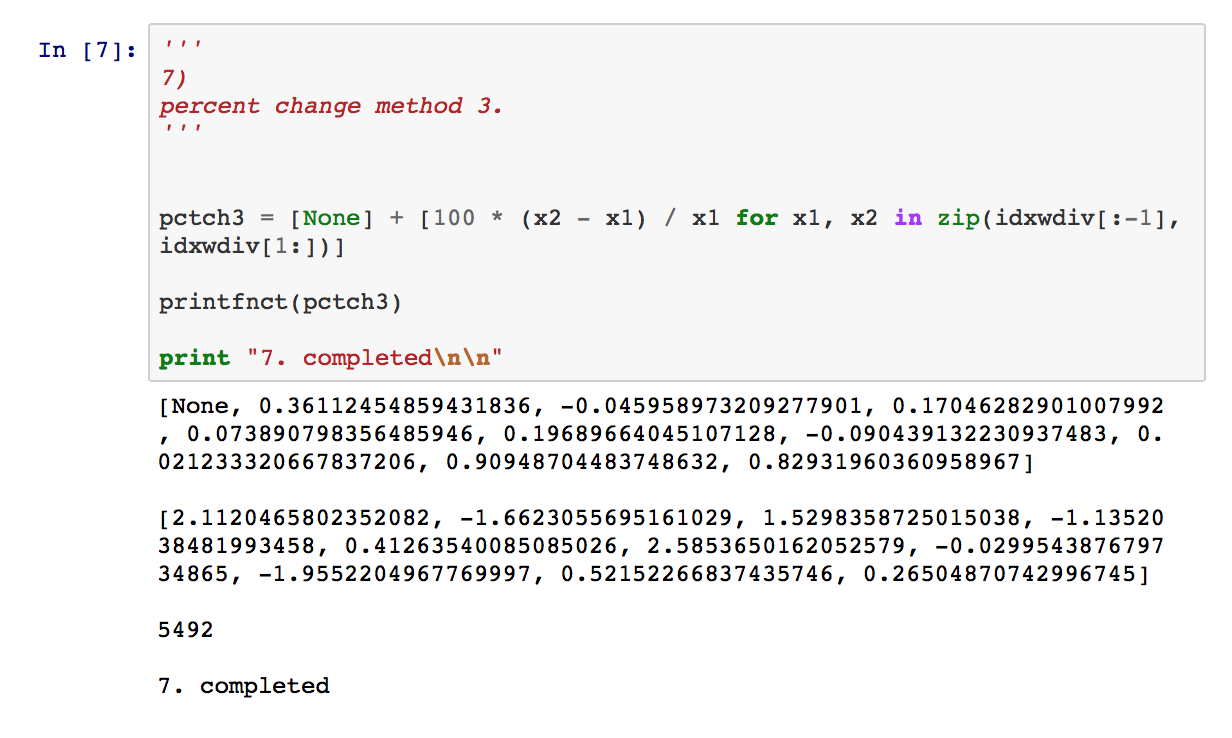
I adopted Python’s core functional flavor 10 years ago, framing algorithms around “iterators”, “map”, “zip” and “list comprehensions” that loop over collections implicitly. The resulting code is generally terse and elegant. I now attempt to formulate almost all core Python code with functional constructs.
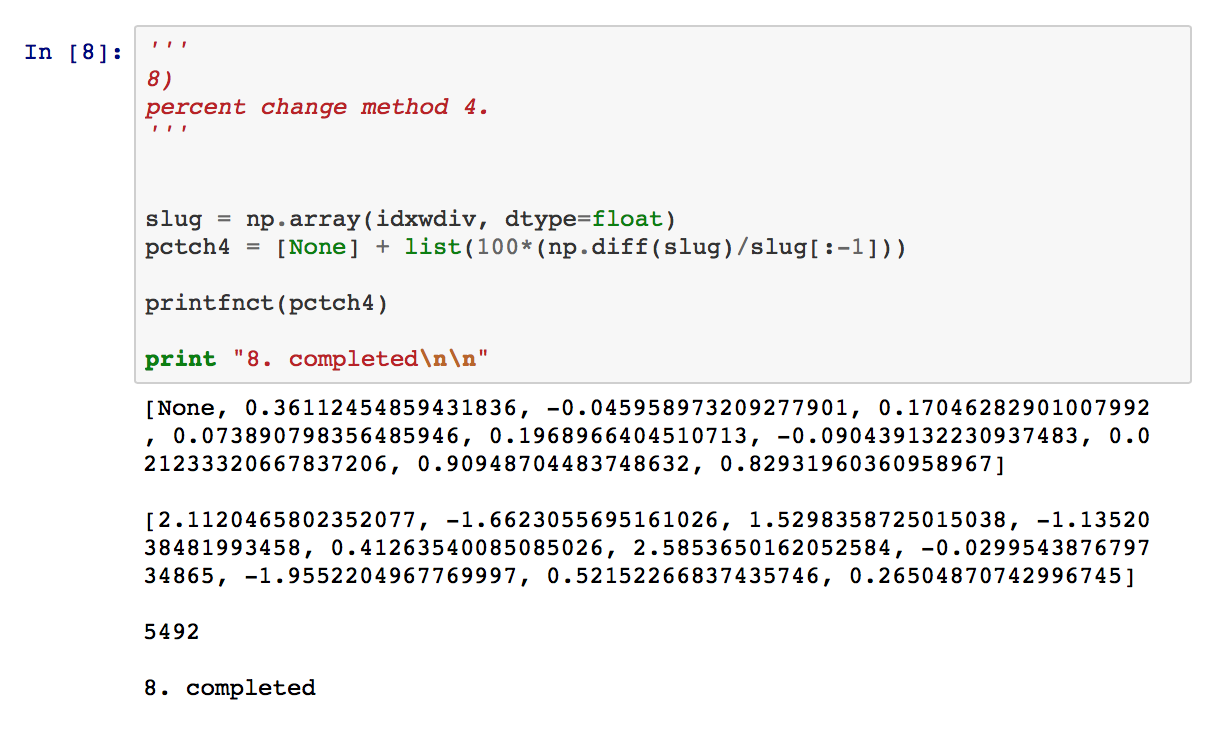
8) and 9) demonstrate the power of the Python community. Both solutions derive from add-on libraries, and both significantly simplify coding through functions that operate on entire arrays at once, relieving the programmer of having to explicitly iterate over lists. 8) uses the now-ubiquitous NumPy package for scientific computing in Python, while 9) deploys the Pandas library for data management/analysis that offers capabilities suspiciously similar to R data frames. In Pandas, a single pct_change method invocation does all the work. In fact, with Pandas and NumPy, Python code looks much like R.
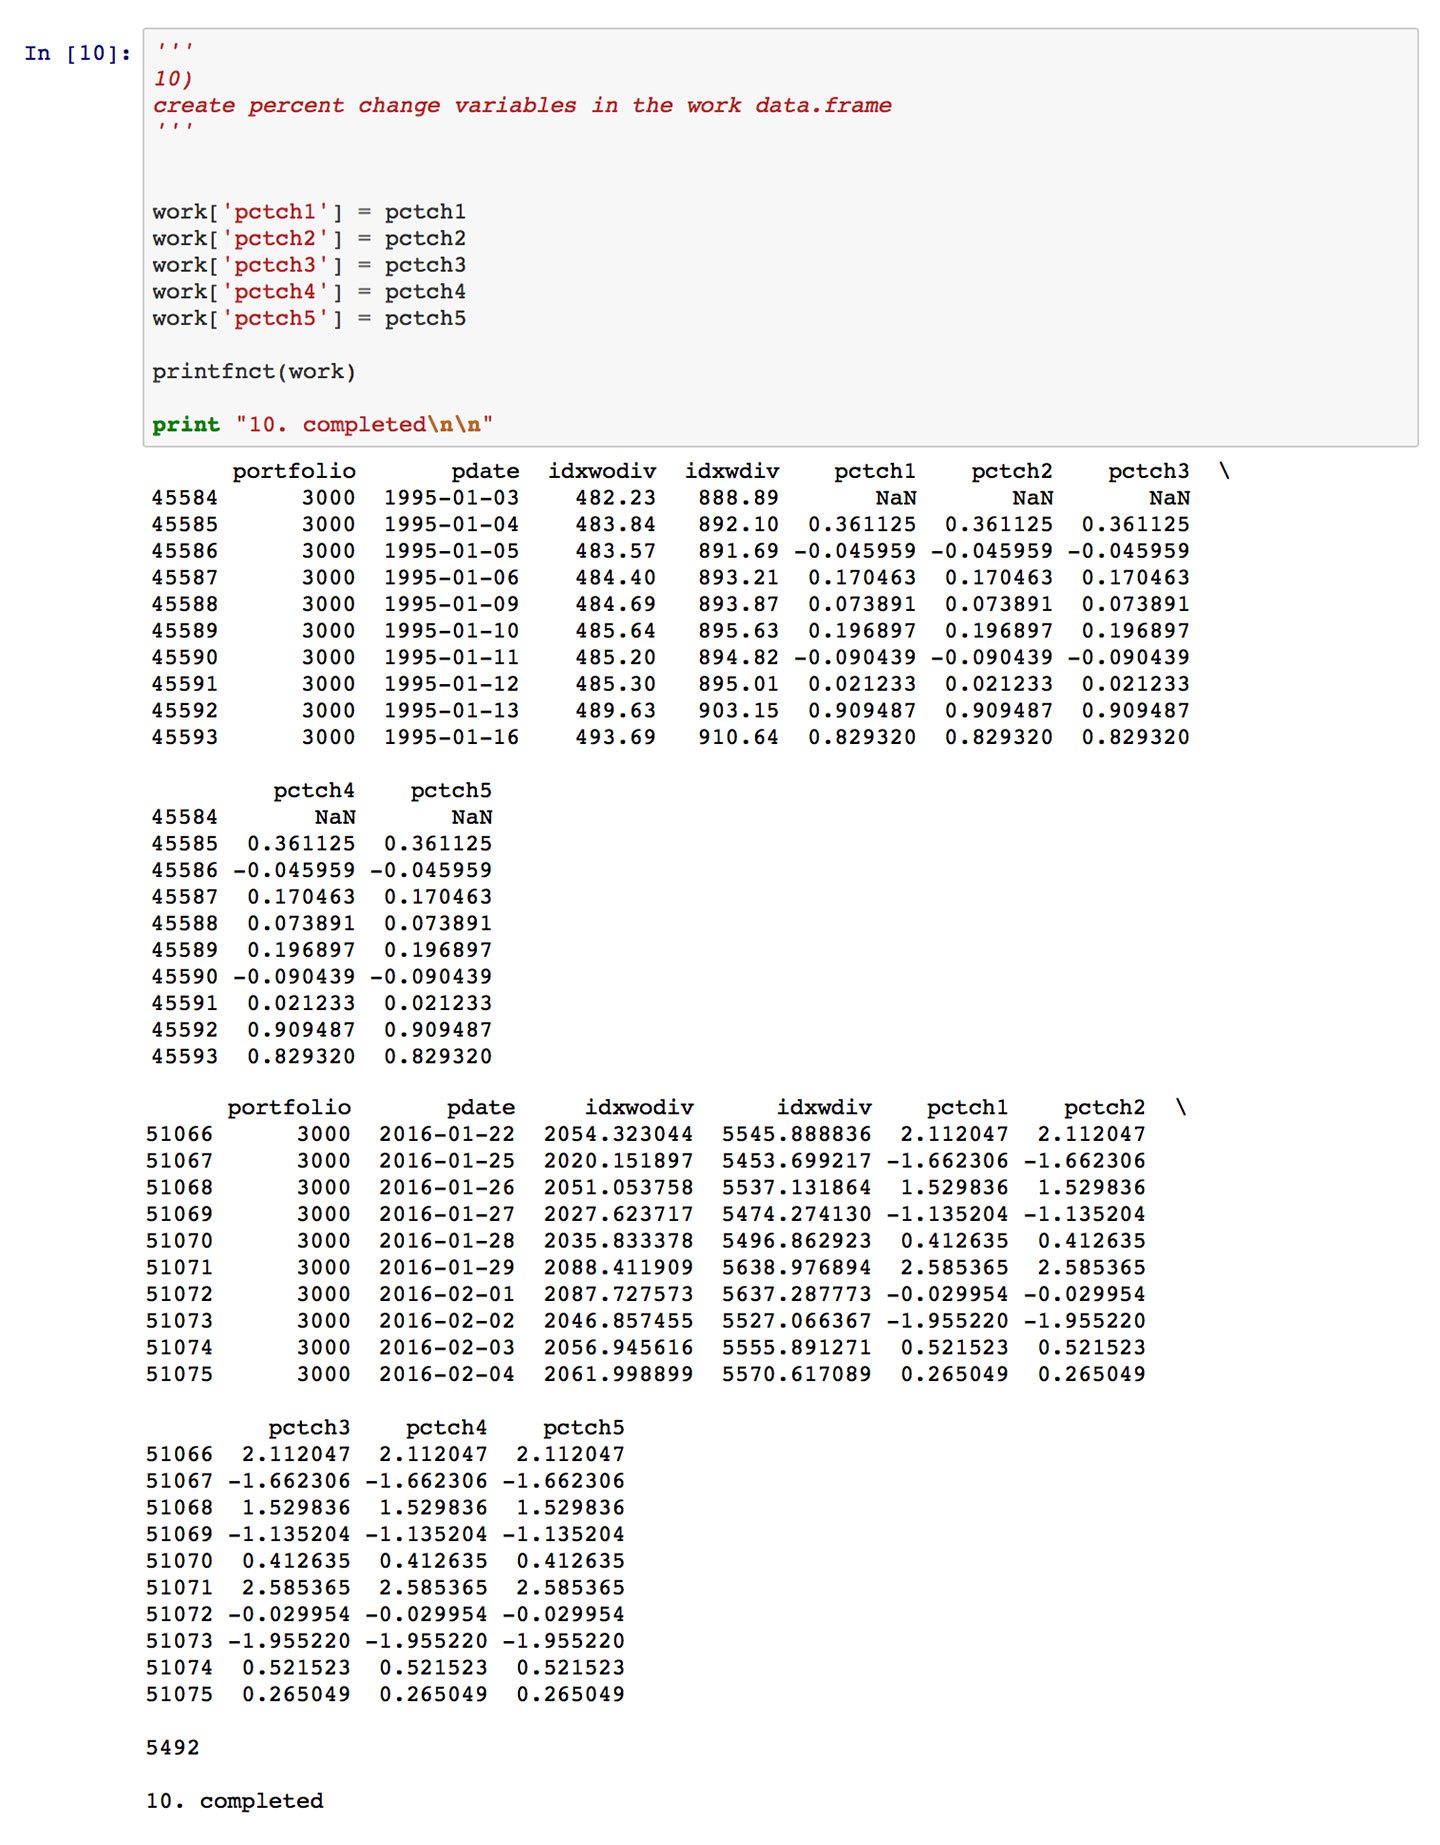
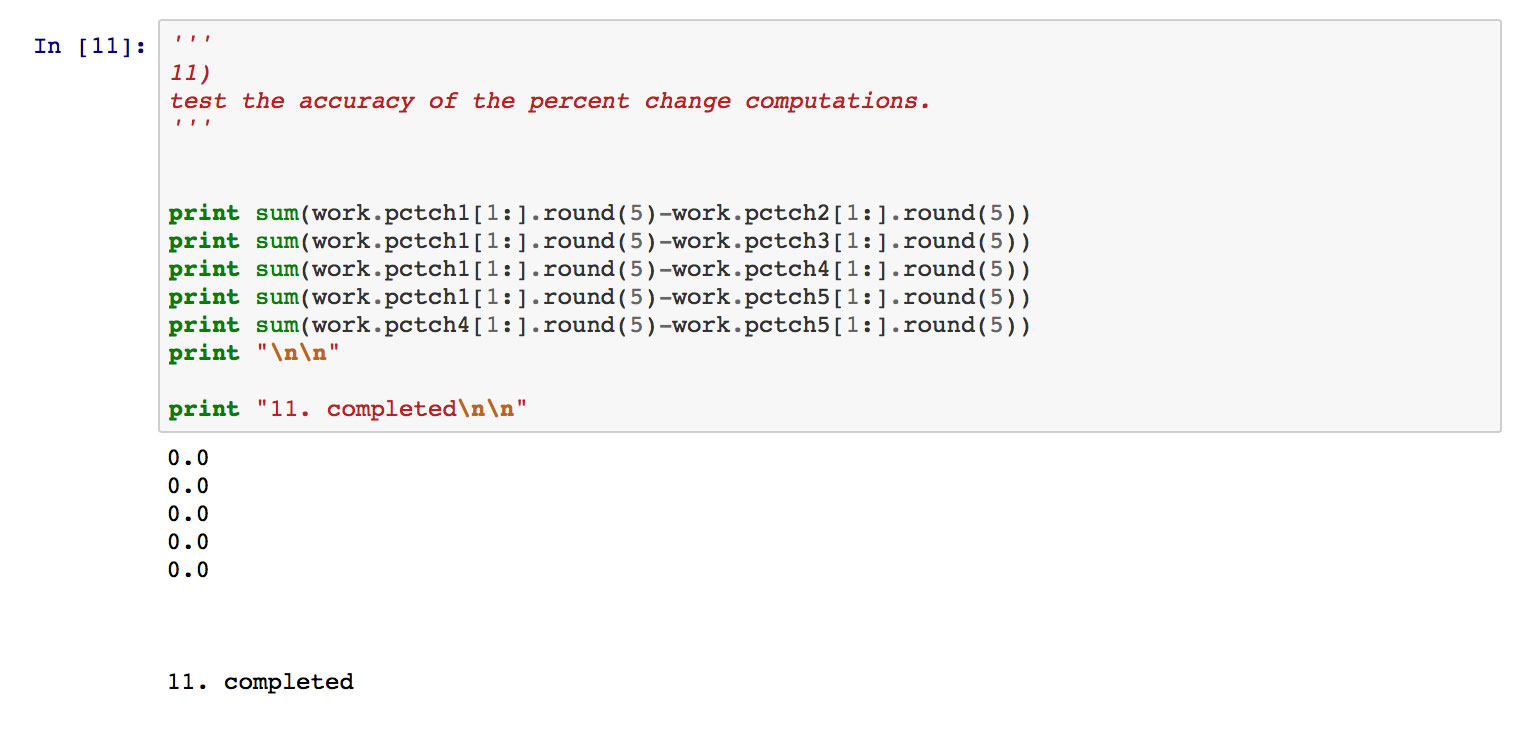
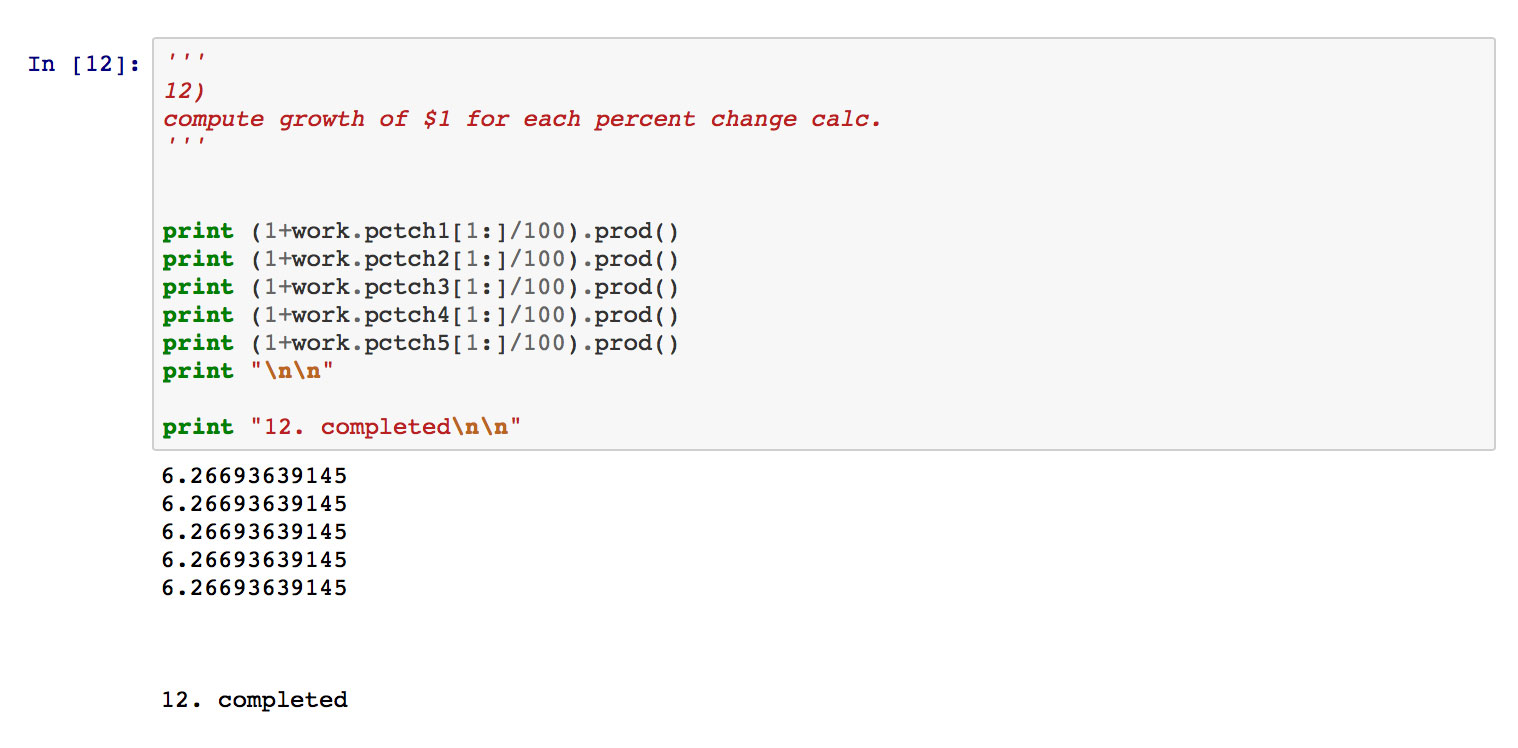
In 10), I take the five computed pctch lists and assign them as attributes to a Pandas data.frame. 11) and 12) show that the different calculations are pretty much identical, save for rounding error. Thank goodness!
What this simple example shows more than anything is the power of the Python ecosystem, where contributions from the community add immeasurably to those of the core language team. The R community offers similar largesse. Indeed, I always remind my staff to conduct rigorous research on the availability of already-developed packages before initiating significant new development in either language. Let someone else do the work.
The engaged, highly-capable, and ever-growing communities of both Python and R offer a compelling explanation for the emergence of both languages as leaders in the Data Science world. My learning progression with Python is testimony.

